Maximize Your Chromebook for Business Investment
Chromebook for business provides security, cost-efficiency, scalable device management and ease of use, but comes with performance issues that impact Chromebook enterprise applications and employee productivity. The most common Chromebook issue searched on Google is “network not available Chromebook”, underscoring Chromebooks’ dependance on Wi-Fi, LAN, internet and cloud network connectivity.
This article explains how to gain end-to-end performance monitoring insight into Chromebook enterprise performance from device to app–and every network and cloud in between–so you can quickly detect, diagnose and resolve Chromebook performance issues and make the most of your Chromebook enterprise investments.
Why Do Chromebooks Have Performance Issues?
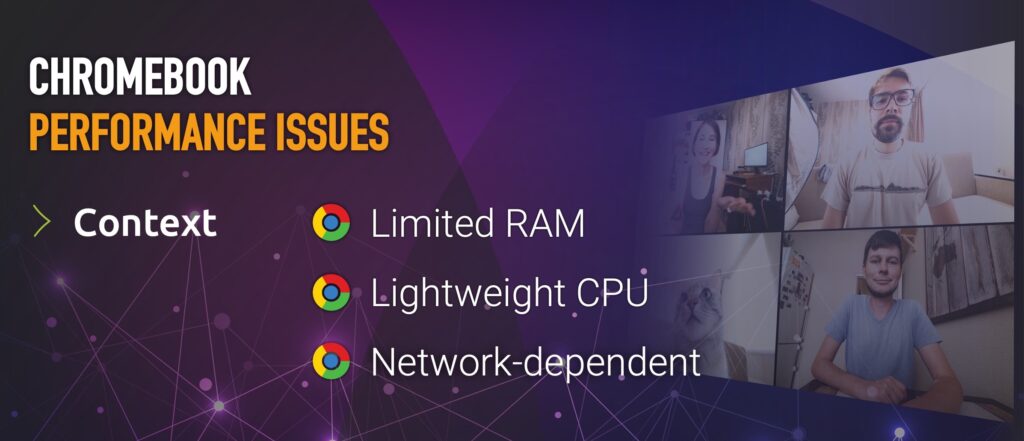
Chromebooks, while affordable and straightforward, come with certain limitations:
- The limited RAM in most Chromebooks can pose a problem if multiple business applications are running across multiple Chrome tabs.
- The CPU in Chromebooks is typically not as powerful as those in Windows PCs or Macs, which can also cause performance issues when web applications demand multiple resources or execute large scripts in the browser.
- Network access is essential for Chromebooks to function as they are primarily designed for online use. If network latency and accessibility degrade, so do applications and the user experience.

- Chromebook RAM and CPU capacity can impact performance for business applications in Chromebook enterprise environments
Top 5 Causes of Chromebook Performance Issues
Chromebook performance issues can be caused by many different factors between users and the Chromebook enterprise applications they use, including device, browser and application cloud hosting performance to the complex series of networks that connect them.
Network issues are the most common and most difficult to diagnose. Slow internet speed, poor Wi-Fi signal strength, network interference, DNS issues, proxy settings, and VPN issues are only some of the network issues that can cause Chromebook performance issues.
Here are the top 5 causes of Chromebook performance issues:

1. Device Issues
- Chromebook Hardware and ChromeOS: are the hardware specs up to the task at hand? Is the OS up to date?
- Chrome Browser: Too many extensions? Conflicts? Background tab processing optimized? Chrome updated?
2. Wi-Fi and ISP Issues
- Wi-FI Connectivity: Are all locations signal-strong? Do devices and access points support 5GHz and Wi-Fi 6 options where high bandwidth is required? Are they connecting to these hotspots or falling back to 2.4GHz or cellular connections?
- Internet Connectivity: Does the ISP connection have sufficient bandwidth, efficient DNS resolution and low-latency connections to other leading ISPs and cloud providers? Is there a backup / secondary ISP connection?
3. Zero Trust Network Issues
- Secure Gateways, Cloud Access Security Brokers and VPNs: Are VPNs, CASB/SASE security networks/proxies causing processing delays, bandwidth constraints, or network path length and latency?
4. Site to Cloud Connectivity
- SD WAN and Cloud Networks: are latency-sensitive and bandwidth-hungry apps prioritized over SD WAN? Are underlays performing, and the right ones selected? Are cloud networks impacting performance?
5. SaaS and Cloud Hosting Performance
- Responsiveness and Availability: Hosts responding quickly? Browser-server API call and transaction errors? Are certain services, application components, or hostnames (including 3rd-party extensions/plugins and integrated apps) slow or unresponsive?
- Geographic Coverage: Are certain apps, components, or sites slow? Users directed to nearest hosts? CDNs serving all key business regions?
How to Monitor and Troubleshoot Chromebook Performance
Given the many ways Chromebook performance can be impacted, the ability to quickly identify issues, understand their scope and diagnose the root cause is essential. Simply knowing whether a problem originates from the device, browser, Wi-Fi, network, service or application provider can cut Chromebook problem resolution time from weeks to hours. Conversely, knowing Good and you
Drilling down into each domain to identify the precise transaction, network segment, device profile, or application component correlates further reduces MTTR from hours to minutes and enables IT organizations to effectively prioritize the resources needed to address areas under their control, or to present the proof necessary for service providers and app vendors to promptly address the issue.
Diverse Perspectives Reveal Chromebook Performance Issues
Achieving this level of visibility requires complementary, yet integrated approaches:
- End-to-end network path and performance monitoring
- Digital experience monitoring of the real user experience
- Analytics and automated diagnostics to correlate these two perspectives

Digital Experience Monitoring
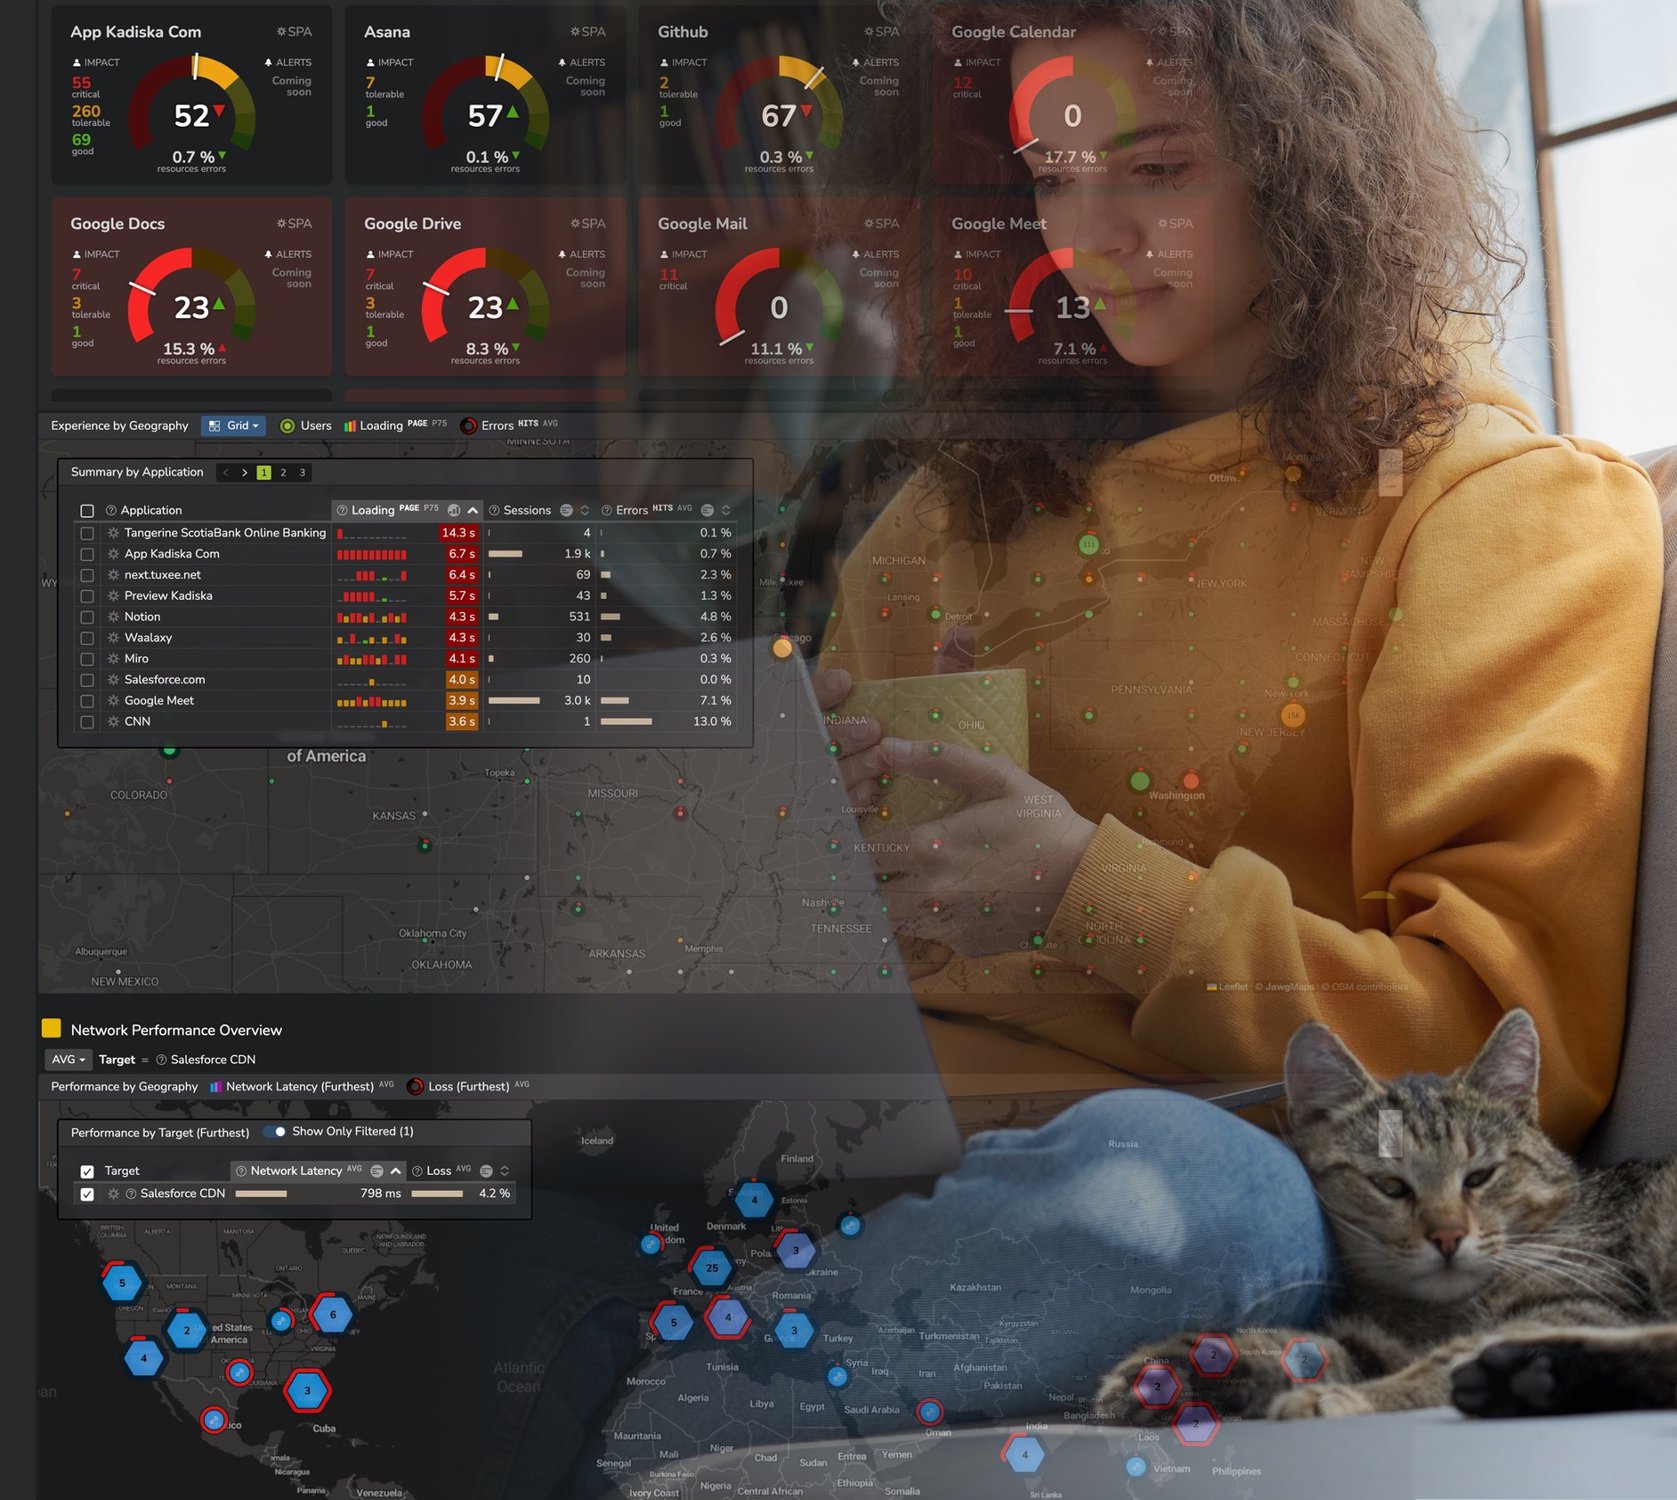
Digital experience monitoring captures application performance from the end user’s perspective and helps IT organizations understand which part of their infrastructure is causing issues by measuring every transaction performed by every user on every device.
By directly measuring the response of applications from the browser, digital experience monitoring aligns VPNs, CASB security, ISP performance, and device RAM and CPU availability with application hosting responsiveness and identifies the precise transactions, host, software, and application components involved.

Digital experience monitoring shows where infrastructure issues originate and analyzes the number of affected users, their location, and their commonalities. It also pinpoints application components, hosting locations, and resources causing delays.
Network path and performance monitoring can be used to pinpoint network segments and providers responsible for network issues. Digital experience monitoring can exonerate the network when it has little effect on digital experience and eliminate speculation or blaming Wi-Fi when it’s not at fault.
Network Path and Performance Monitoring
With cloud and SaaS applications, SD WAN, hybrid connectivity, and remote employees, traffic capture and flow analysis (NPM)-based network performance monitoring is no longer adequate.

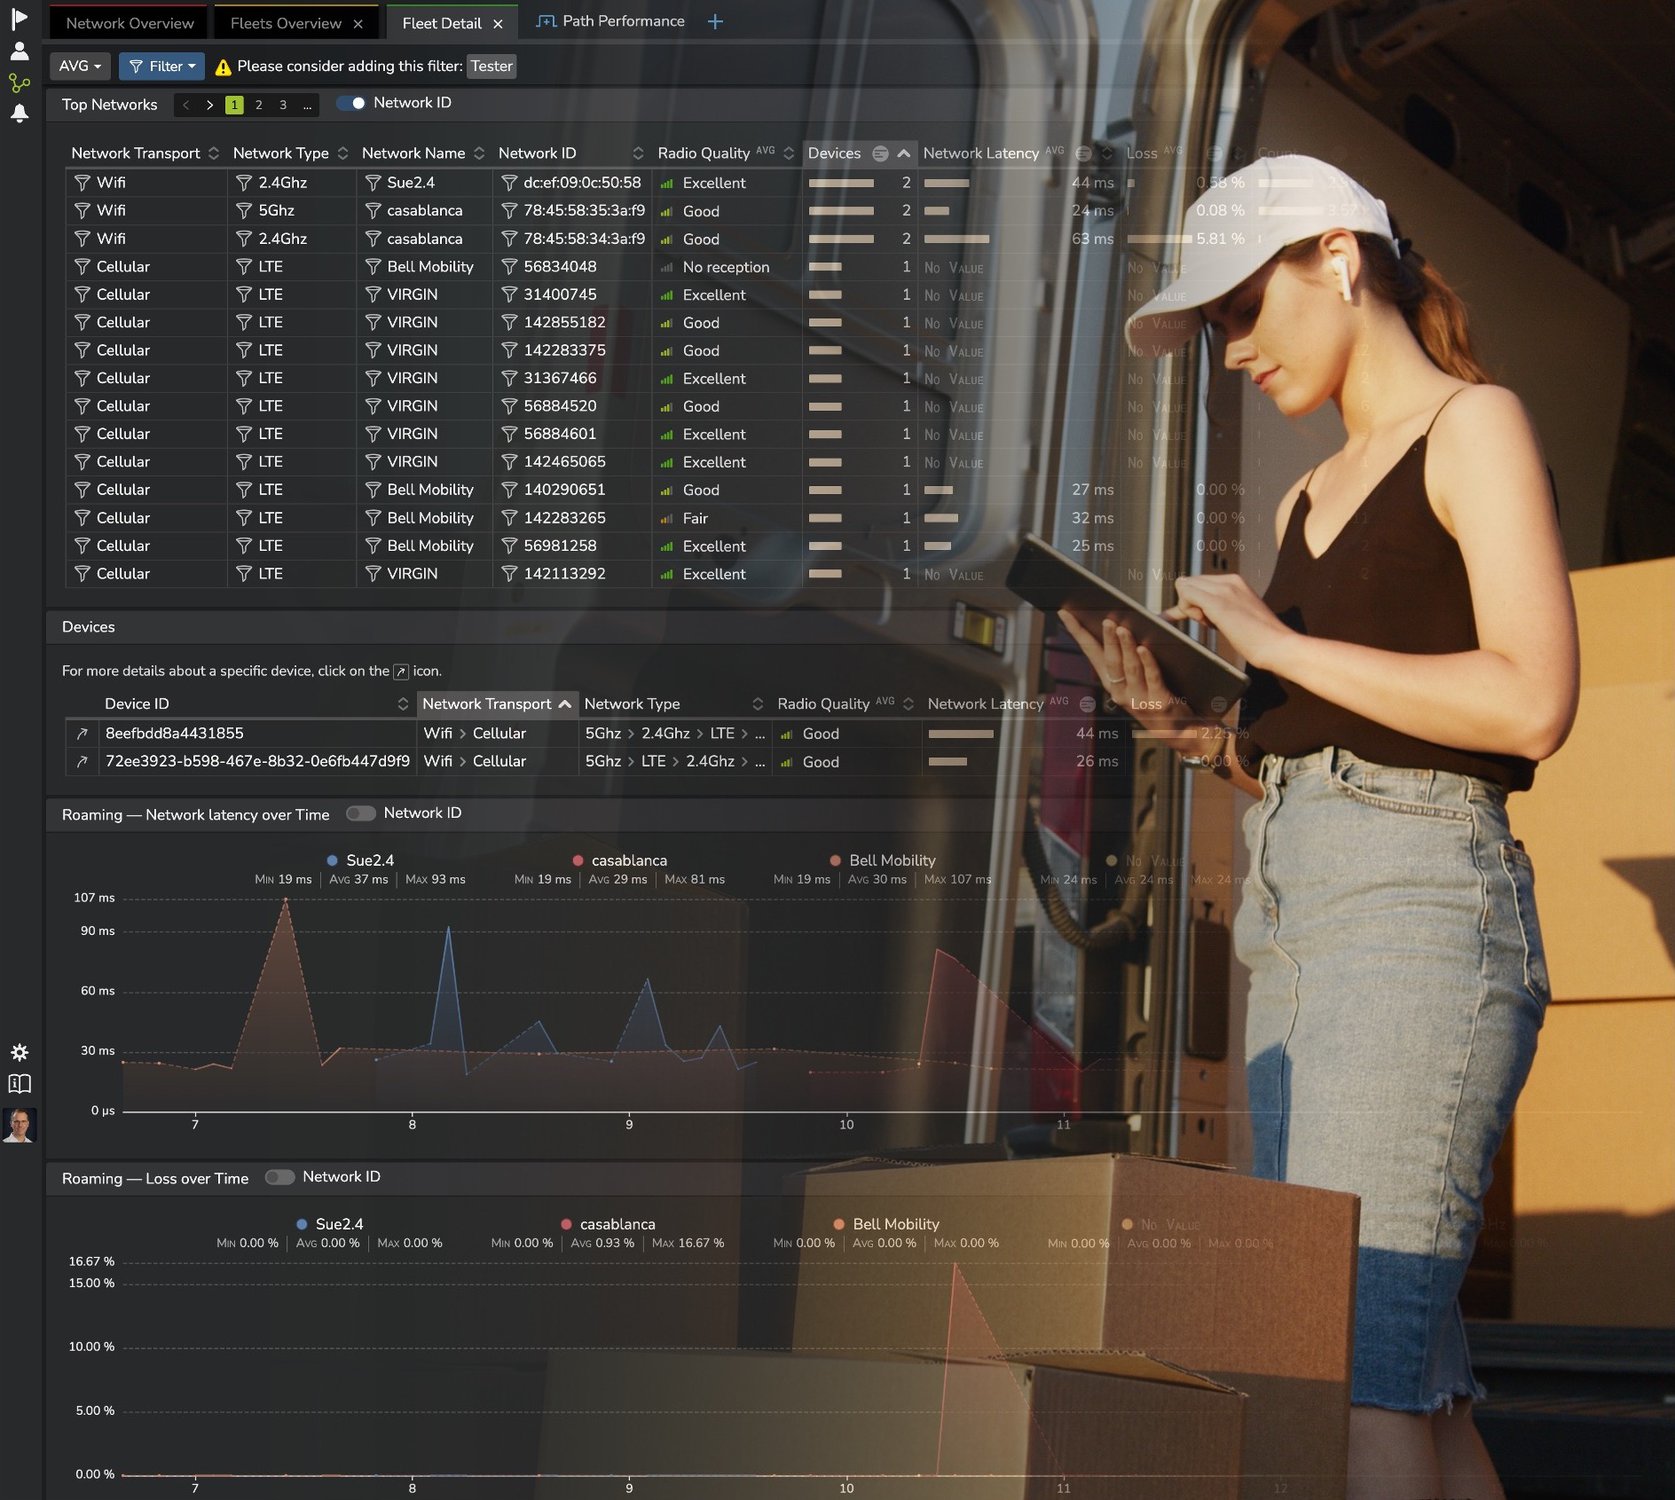
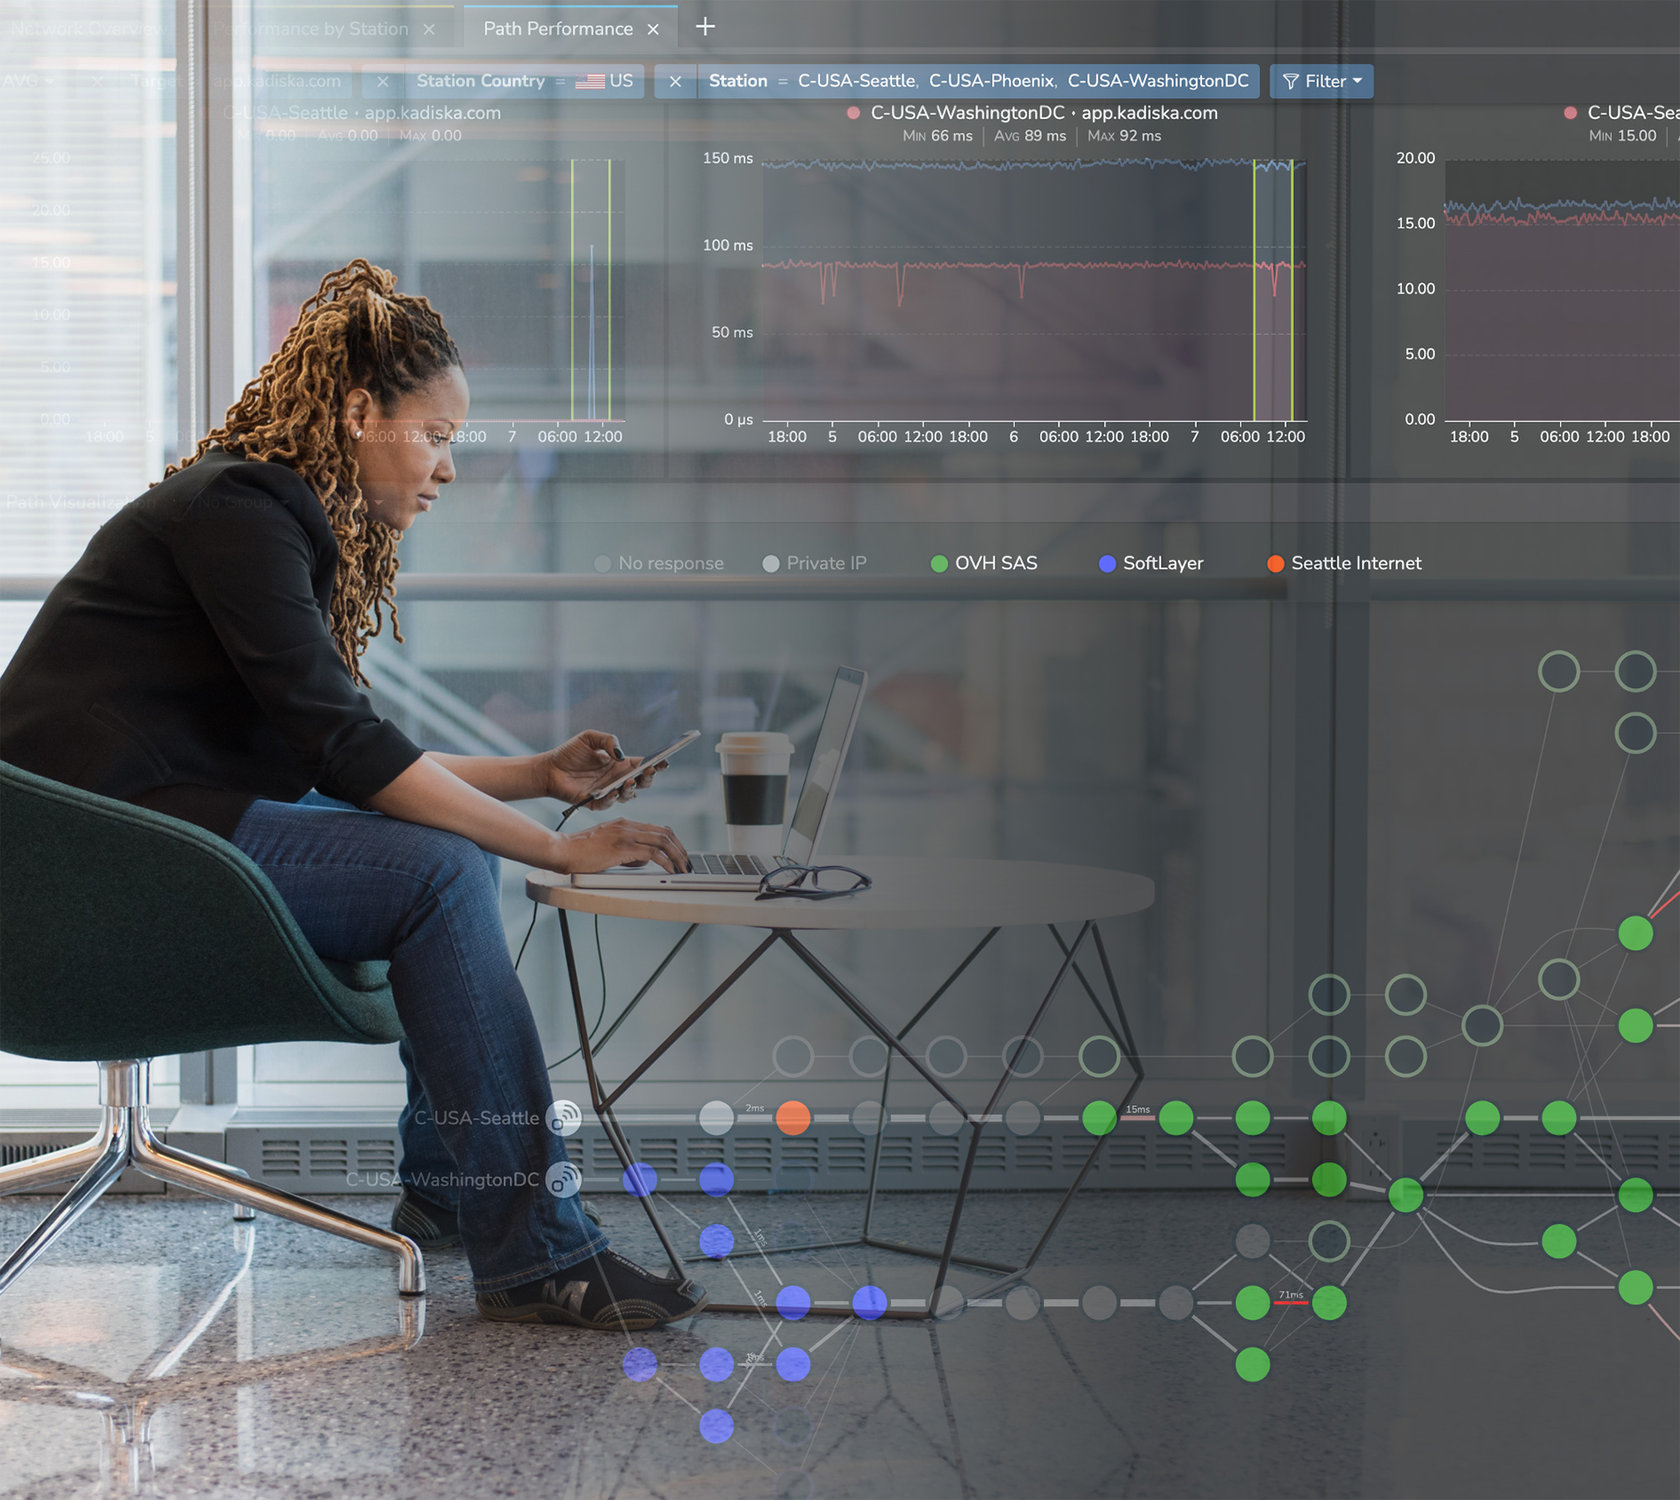
Synthetic network path monitoring (network tracing and visualization) overcomes this visibility gap by continuously tracking the network path and the network performance of all segments and service providers between users’ Chromebooks and cloud-hosted applications.
Network operations teams can identify BGP routing and redirection issues, Wi-Fi issues, cloud network connectivity issues, ISP, and SD WAN degradations, and where latency, loss, and application performance issues are introduced in the context of users, locations, and applications.
How to Deploy Chromebook Performance Monitoring
The Kadiska platform offers a good example of how to deploy Chromebook performance monitoring, as it offers both network path performance and digital experience monitoring for SaaS and web applications in a way that is easily deployed across fleets of Chromebooks.

Tracer – Network Path and Performance Monitoring
Tracer is installed as an Android app that runs natively inside Chrome OS on Chromebooks. It can be installed directly from the Google Play Store or distributed to a large number of devices using standard Mobile Device Management (MDM) or Enterprise Mobility Management (EMM) solutions. This lightweight app runs in the background continuously to measure network performance from Chromebooks to target applications.
Watcher – Real User Digital Experience Monitoring
The Watcher component is a Chrome extension that monitors application performance directly from the browser. The Watcher extension can be installed from the Chrome store or deployed using Google’s GPO and other browser management solutions (including Microsoft Intune).
Digital Experience Platform
The data from Tracer and Watcher are sent back to the Kadiska platform, which reports the results in real time, provides automated diagnostics and analytics, alerts and application experience scoring dashboards (Apdex).
To see it in action, watch our Chromebook performance webinar and skip ahead to the demo section.
Start Monitoring Chromebook Performance
It’s easy to try Kadiska Chromebook performance monitoring. The entire solution can be deployed within 30 minutes, and it takes only a few minutes to request a free trial you can evaluate in your environment to see Chromebook performance the way your users experience it.