Guided Analytics
360° Visibility on User Performance Across Applications, Network and the Real User Digital Experience


Digital Experience Monitoring for all users and all applications
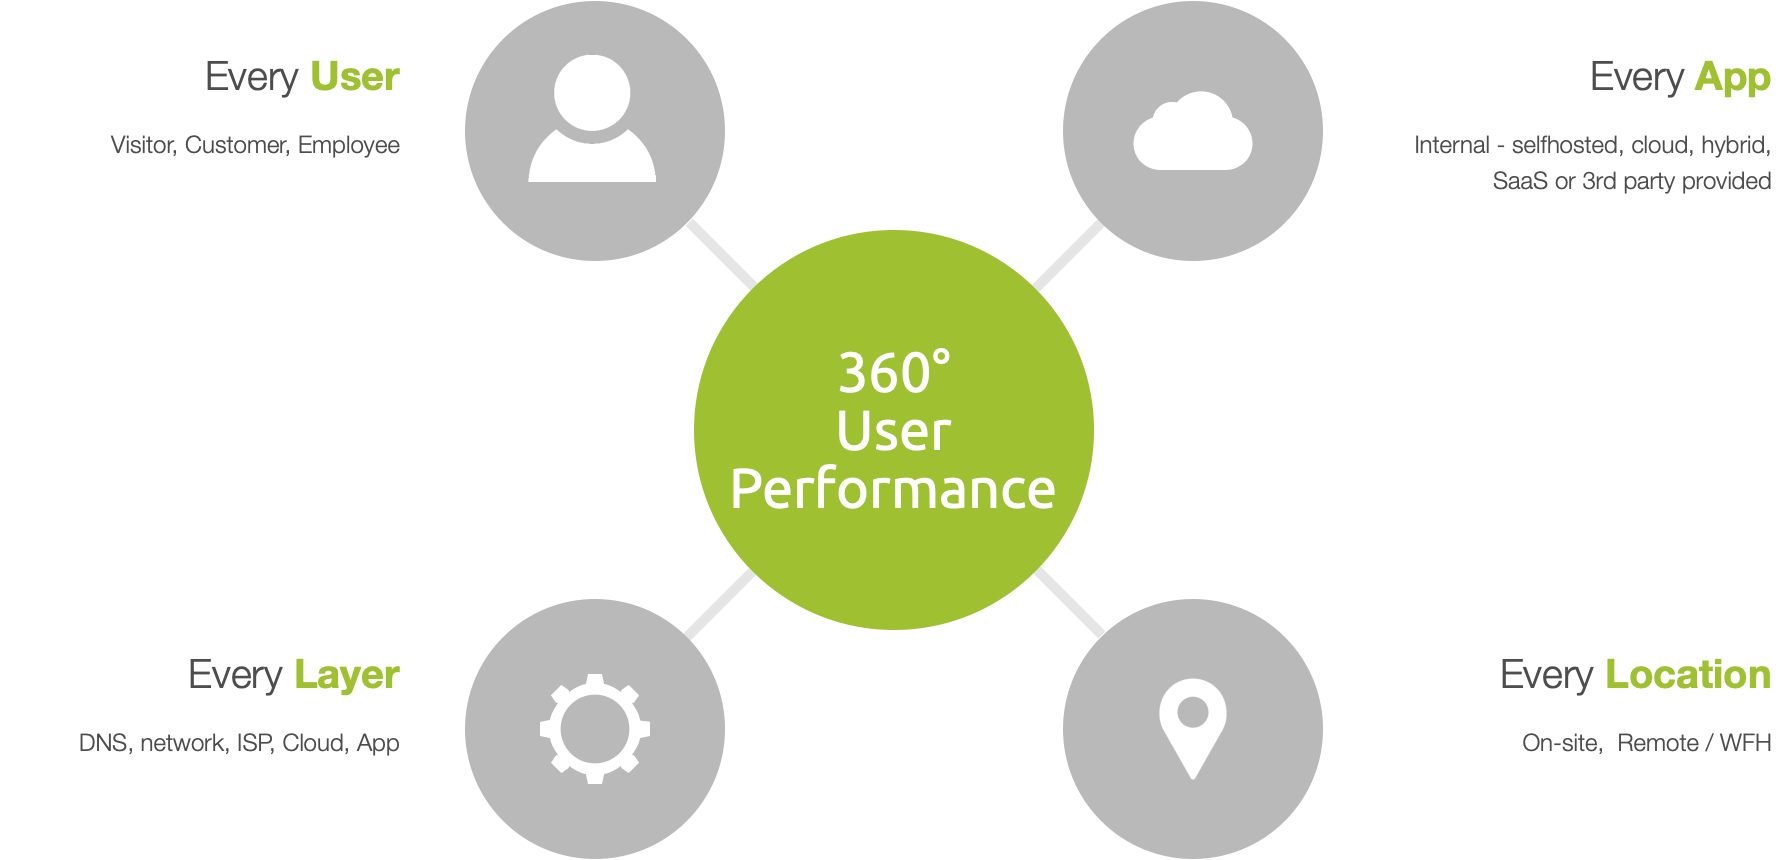
Discover Kadiska’s Platform for Digital Experience Monitoring with 360° performance visibility into every user, application, infrastructure layer, region and location: onsite, remote and work from home.
Kadiska's Platform
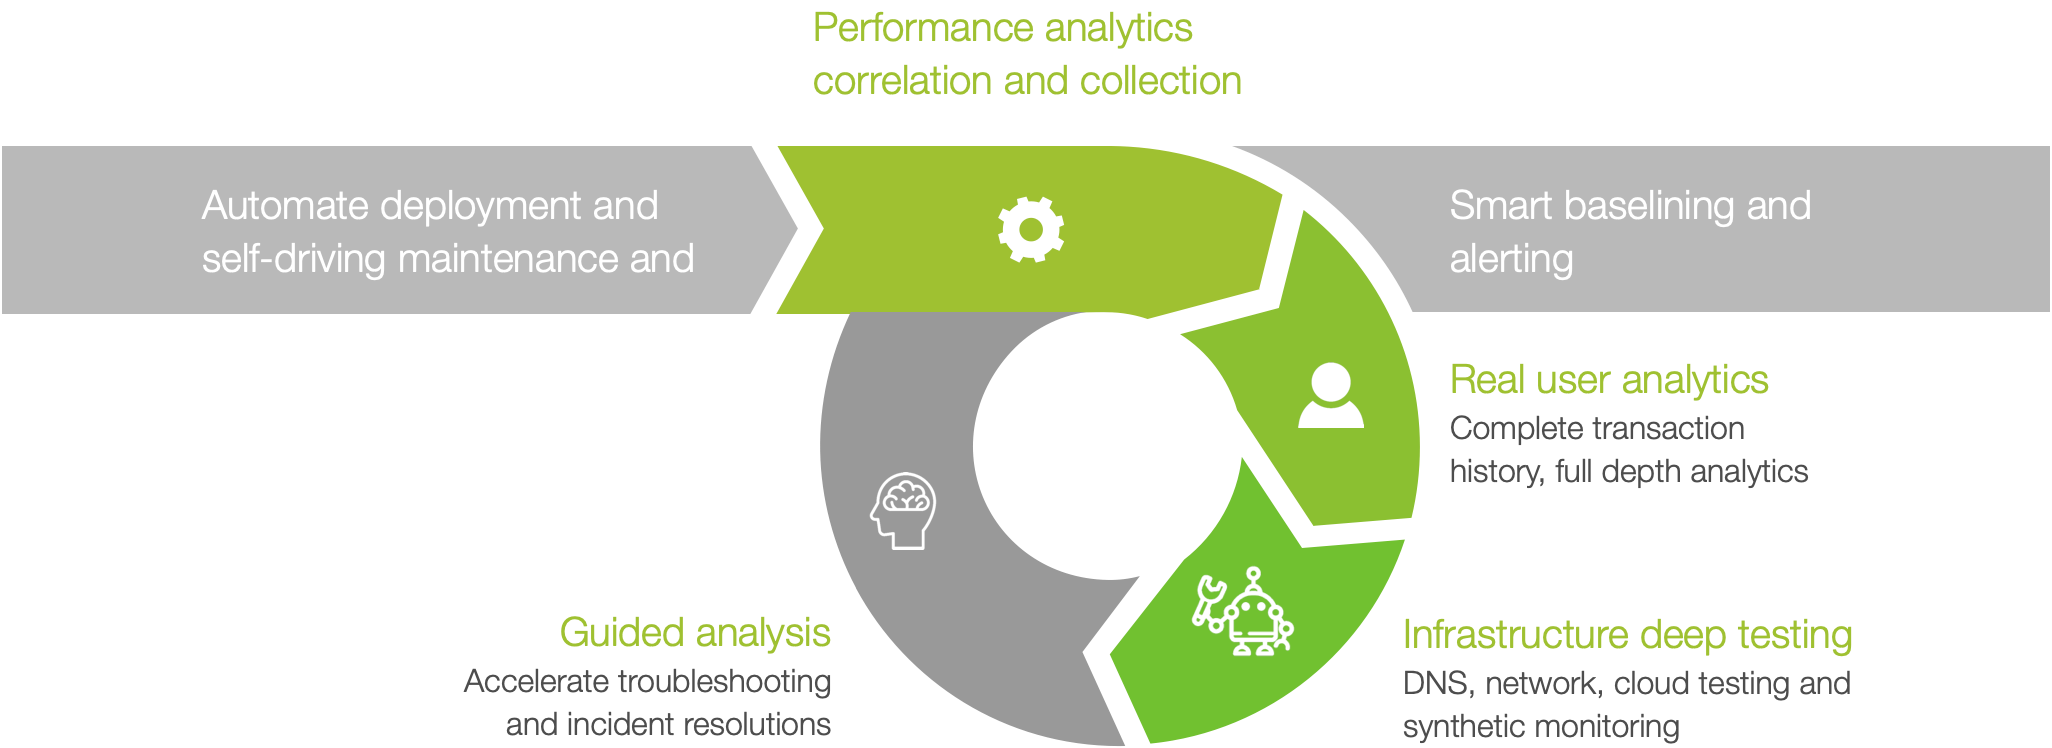
Kadiska’s platform aims at combining complementary sources of performance analytics and automating all steps in operating a digital experience monitoring platform.
In a nutshell Kadiska’s platform helps keep user performance under control in a context of modern apps (SaaS, cloud based or hybrid) and hybrid infrastructure by collecting and correlating multiple sources of performance analytics:
- Real user transaction data, to its highest level of details and depth
- Network and infrastructure deep testing applied to hybrid infrastructures (public networks, SD WAN, cloud, traditional)
- Synthetic monitoring
Automating deployment and providing a zero-touch configuration and self-driving maintenance of all its components:
- Running data collection and analysis on an hyper scalable platform
- Providing a unique user interface enabling guided troubleshooting capabilities
- Delivering smart baselining and alerting


Kadiska's Performance Analytics
Kadiska’s hyper scalable data platform runs real time analysis to provide guided troubleshooting interface, dashboards and real time alerting on a combination of performance analytics.
Learn more about Kadiska’s analytics:
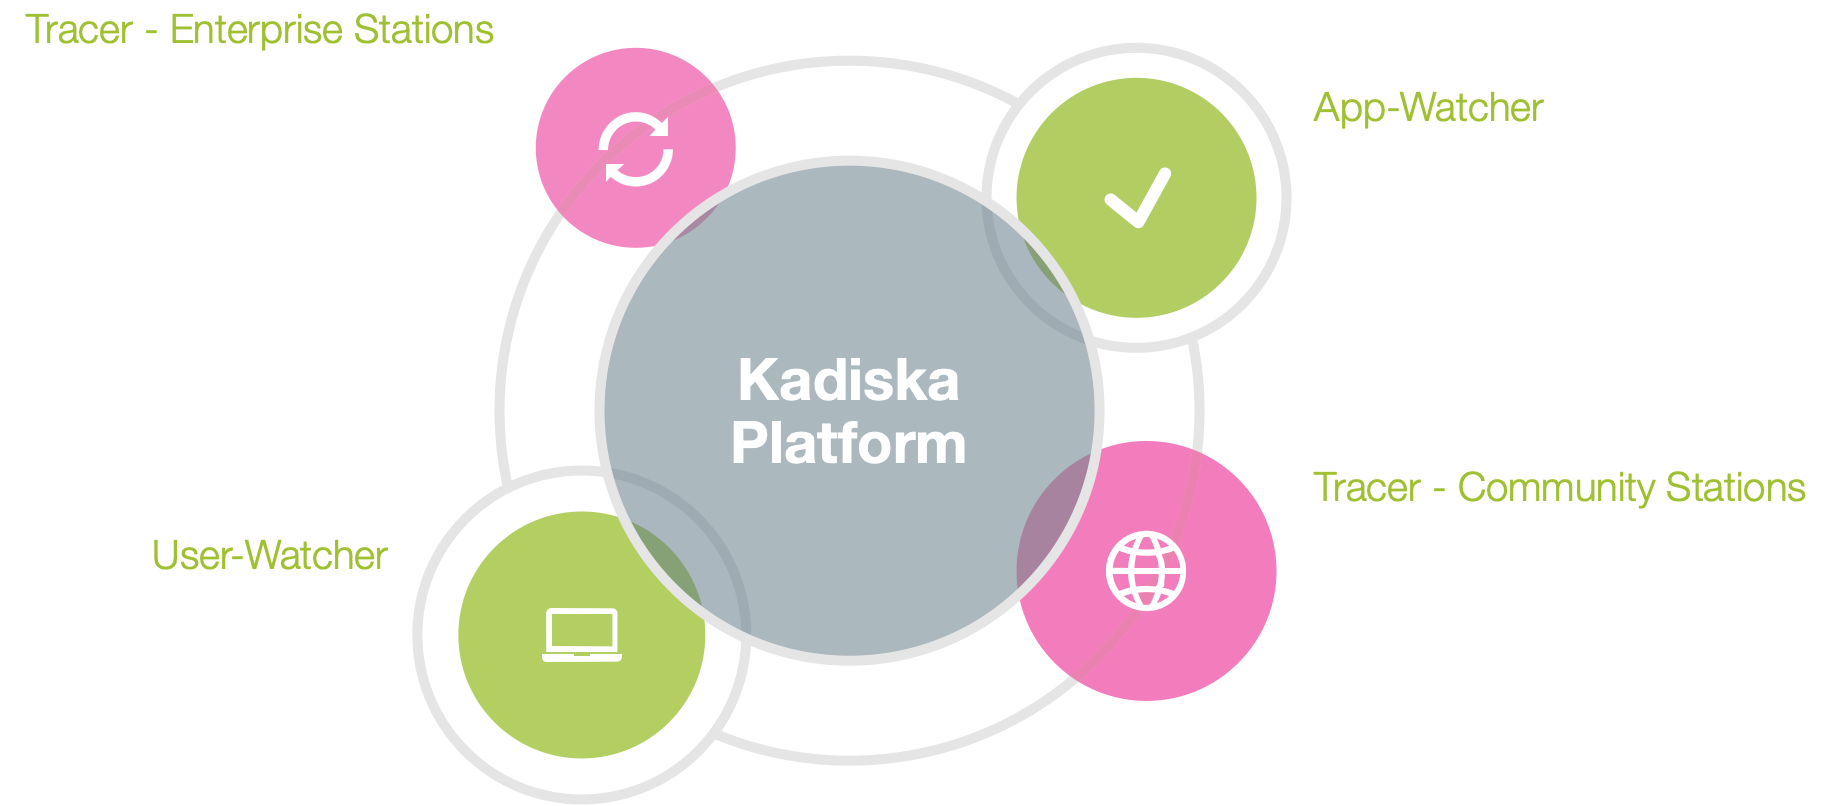
User-Watcher – monitor employee digital experience and optimize productivity
App-Watcher – understand and enhance your web apps’ customers experience
Tracer – end-to-end insight into network path and performance to drive out latency


