on SD-WAN monitoring")
SaaS applications are different in many ways from traditional private applications. They are so different that NPM and APM solutions can’t see many SaaS performance issues or their underlying causes.
What’s changed? SaaS applications are not only hosted on infrastructure that’s outside of the control of IT, they also drive the adoption of cloud-powered security, access and networking with SASE, SWG, CASB and SD WAN that both enable and impact a distributed workforce.
Kadiska’s co-founder Boris Rogier was invited to share his expertise on SaaS and web application performance monitoring at the recent ITSM and Digital Transformation Summit. This article summarizes the key points from this presentation that cover the challenges legacy monitoring tools face, and the reasons why a new approach to monitoring SaaS performance is needed to deliver a productive digital experience to employees onsite and working from home.
The SaaS Performance Visibility Gap
Let’s go back to the time where most enterprise applications were accessed through a private network from on premises locations.
This was a time where most enterprises actually had fairly good visibility into the user experience. Then, with digital transformation coming in the cloudification process got started. We suddenly added a number of new technologies and infrastructure options that were extremely beneficial from deployment, globalization, cost and flexibility standpoints… but they also came with visibility gaps.
The shift of workloads from private data centers to public clouds was accompanied by the early majority of SaaS adoption. This introduced a significant change in how and where applications are hosted. And from an access standpoint–the critical link between users and application–we started using public, internet-based networks alongside the private circuits that were traditionally used.
The dynamics of SD WAN networks, and the approaches that were introduced to secure work from home users like secure web gateways, CASBs and SASE solutions in general became either a replacement or alternative to VPNs and private connectivity.

These are the primary changes that resulted in significant visibility gaps that our traditional monitoring tools struggled to address. Even after a number of years they have not been able to evolve to effectively monitor this new digital infrastructure environment.
APM Monitoring Relies on Platform Control
For example, APM cannot really adapt to SaaS and PaaS platforms because you can’t instrument them the way you can with private applications. When apps ran in private environments the servers, code and systems were fully in the control of your IT and developers. This is no longer the case with SaaS and applications hosted on PaaS. Even private applications now often integrate third-party components and services, which also limits options to instrument them.
NPM Monitoring Relies on Traffic Analysis
NPM faces another set of challenges. The first being similar to APM: network performance monitoring solutions cannot really be implemented in SaaS and cloud platforms because you can’t efficiently capture traffic there. So they don’t have the input to generate visibility metrics.
The second big challenge is encryption. SaaS and web application traffic now crosses public networks where you can’t allow it to go “in the clear”. Today’s TLS 1.3 encryption is ubiquitous and far more difficult to decrypt and gain visibility that earlier forms of encyption.
The last challenge is the way these new networks work. Public networks are dynamic by definition. So the path you follow can change at any time due to BGP routing, but it can also change based on the user’s location and load balancing requirements–significantly.
This means that also people in one region can be redirected to hosts in a different country or even continent depending on where they are, which operator they use to connect to those applications, and what platforms like CASB / SASE and SD WAN are in between. As we’ll see, this makes traffic capture and correlation nearly impossible using centralized techniques that NPM solutions rely on.
Taken together this creates a new set of complexities that make getting visibility far more complex than it was before. Some would say almost impossible.
Monitoring SaaS Performance: What Doesn’t Work
Let’s double click on the limits of the traditional performance monitoring solutions when it comes to modern SaaS and cloud-based applications, and why they face some difficulties.
NPM Performance Monitoring Shortcomings
Encryption
Network performance monitoring solutions derive insight from traffic analysis. As we pointed out, encryption is one big obstacle to this approach remaining relevant. It prevents these tools from understanding application-level behavior that’s key to reporting user experience and server response time.
There’s no way you can really use traffic analysis if you don’t overcome the encryption problem. And in nearly all cases decryption isn’t a viable option. When you look at third party services like SaaS and PaaS there’s no way you can find a way to decrypt all of the traffic coming from all of the hosts that are involved.
Traffic Capture
Decryption is a significant challenge with TLS 1.3, but implementing effective traffic capture itself is an even larger challenge, because the traffic at both the host and user side is no longer centralized. On the cloud side capturing traffic is very complex, because workloads can move locations, be shared and load-balanced across multiple pods or even sites. It’s highly distributed. You have a huge geographic spread to cover. It’s nearly inconceivable to capture all the traffic from technical and economic standpoints.
If you try to implement traffic capture at the user side, it’s just as difficult. It used to be straightforward when people and traffic was concentrated in a single place. But that’s no longer the case. People work from home. People work from many branch offices, co-working spaces. They change location frequently: in a survey from this webinar we learned that more than 80% of attendees were working in a hybrid mode – some days at home, some days at the office.
SD WAN and CASB make capture even more vexing. The traffic paths change dynamically not only because of networks, but also because of the redirections effect and the distribution of the different platforms.
So that means that even if you’ve got some form of measurements related to the network contribution to the user experience, you don’t know how it’s related, or why it’s happening. You don’t have in-depth insight into the network overlay and underlays to take action and fix problems.
New Protocols
Finally, new protocols like HTTP/2 and –or QUIC–are rarely supported by NPM solutions and actually bring an additional set of visibility challenges in their own right. By allowing parallel traffic download and bypassing traditional TCP handshakes and transactions, NPM solutions without updated protocol support are unable to provide key user experience metrics.

Why Synthetic Testing Falls Short
A traditional way to look at the performance of web applications is synthetic testing. This involves replaying scenarios using robotic process automation that simulates user interaction with an application and monitoring the response. For example, you can verify if users can login, click on a button, access menus and features and verify if responsiveness was within the norms or SLAs that were have been manually configured by the IT performance team. You can learn more about synthetic testing and how it compares with real user monitoring (RUM) in this article.
Scripts and Scenarios
There are two problems with this approach. The first is that if you don’t control the application, there’s no way you can make sure that the scenarios and scripts you create will remain valid or even relevant over time. The maintenance overhead to keep scenarios up to date is expensive, since SaaS applications are changing all the time. Just one menu item chaning can break a script from executing. If you are like most enterprises that rely on SaaS for 80% of their business applications–meaning 50 or more SaaS applications for a large enterprise–it’s not actually practical to use synthetic testing.
Single Page Appliactions
Secondly, synthetic testing was not invented for modern ‘single page applications’, where a user loads the main page then interacts with it through transactions from Javascript API calls. Think Google Drive, or Gmail that only have a single page you can spend the entire day working from. If synthetic testing determines application performance from page loading times, and there is only one page to monitor, there are no measurements that can really be made.

Real User Monitoring (RUM) vs. SaaS and Web Applications
RUM is the other, traditional way to look at application performance for web-based applications. It consists of placing a script in the application, then collecting data from the user’s device or browsers. This works well if you’ve got access to the code of the application and the hosting platform, but neither are true for SaaS applications or those built on PaaS environments.
This is also true for packed applications running on any environment–public or private. As long as the vendor doesn’t offer you the possibility to actually insert that script and collect data, the tools will be blind.This makes implementing RUM very challenging.
The Problem With Agents
There are additional problems introduced by RUM solutions that rely on software agents installed on the end-user devices. These agents can impact device performance by consuming resources, and have also shown security vulnerabilities. Agents are usually designed to run on Windows machines, deployed through central policies. As we see BYOD, Chromebook and tablet devices now used by an increasing number of employees, agents are becoming less effective in capturing the user experience, especially in a work from home environment.
In summary, the traditional approaches to application and network monitoring that we’ve relied on to provide a clear view of the user experience and what impacts it do not align with the new architecture of modern SaaS and web applications.

A New Approach to SaaS Application Performance Monitoring
Although legacy NPM and APM tools struggle to maintain visibility into SaaS and web applications, especially in the context of work from home and highly distributed employees, digital experience monitoring has also evolved.
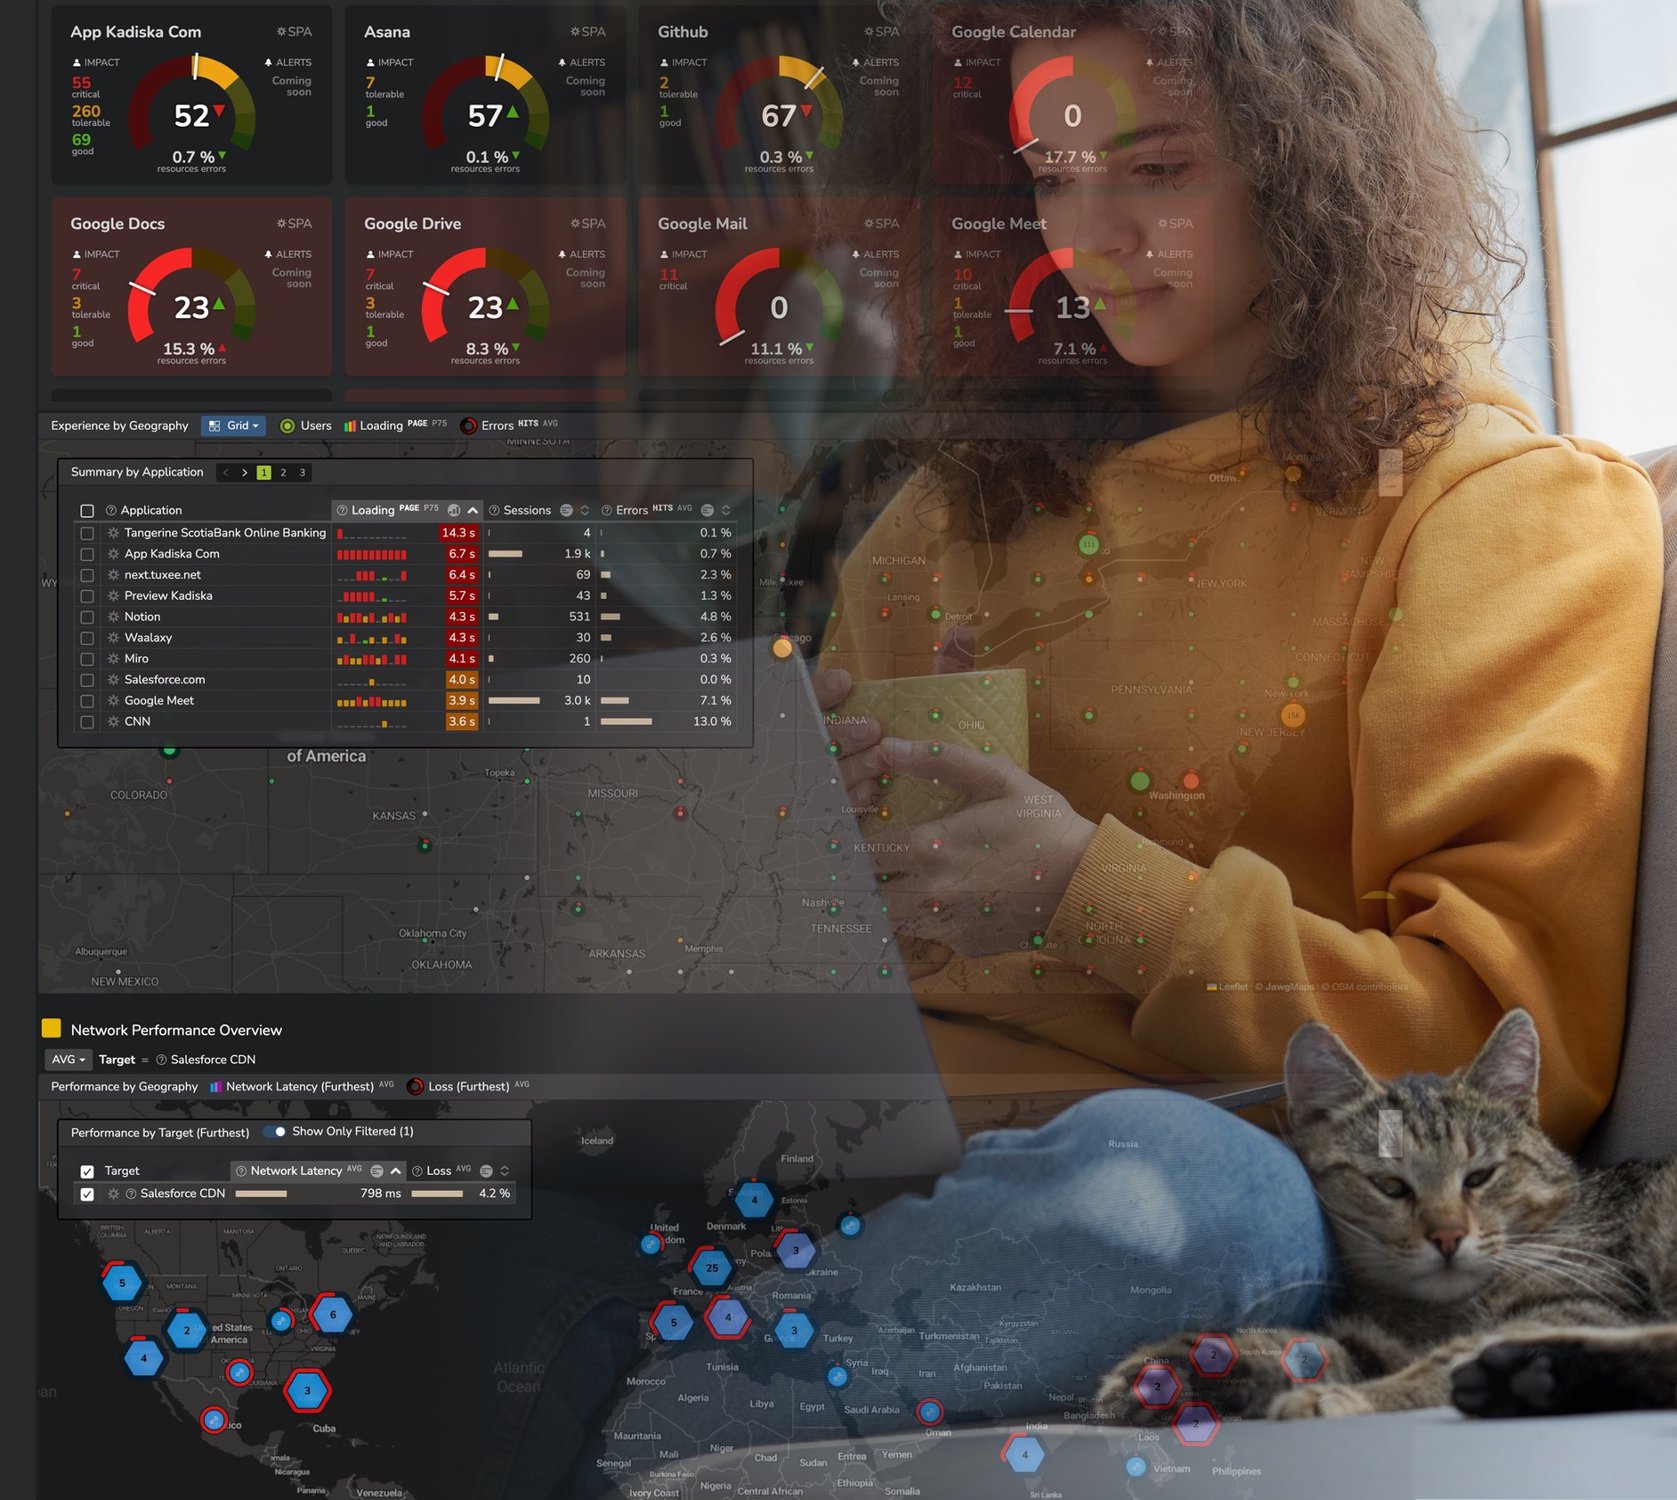
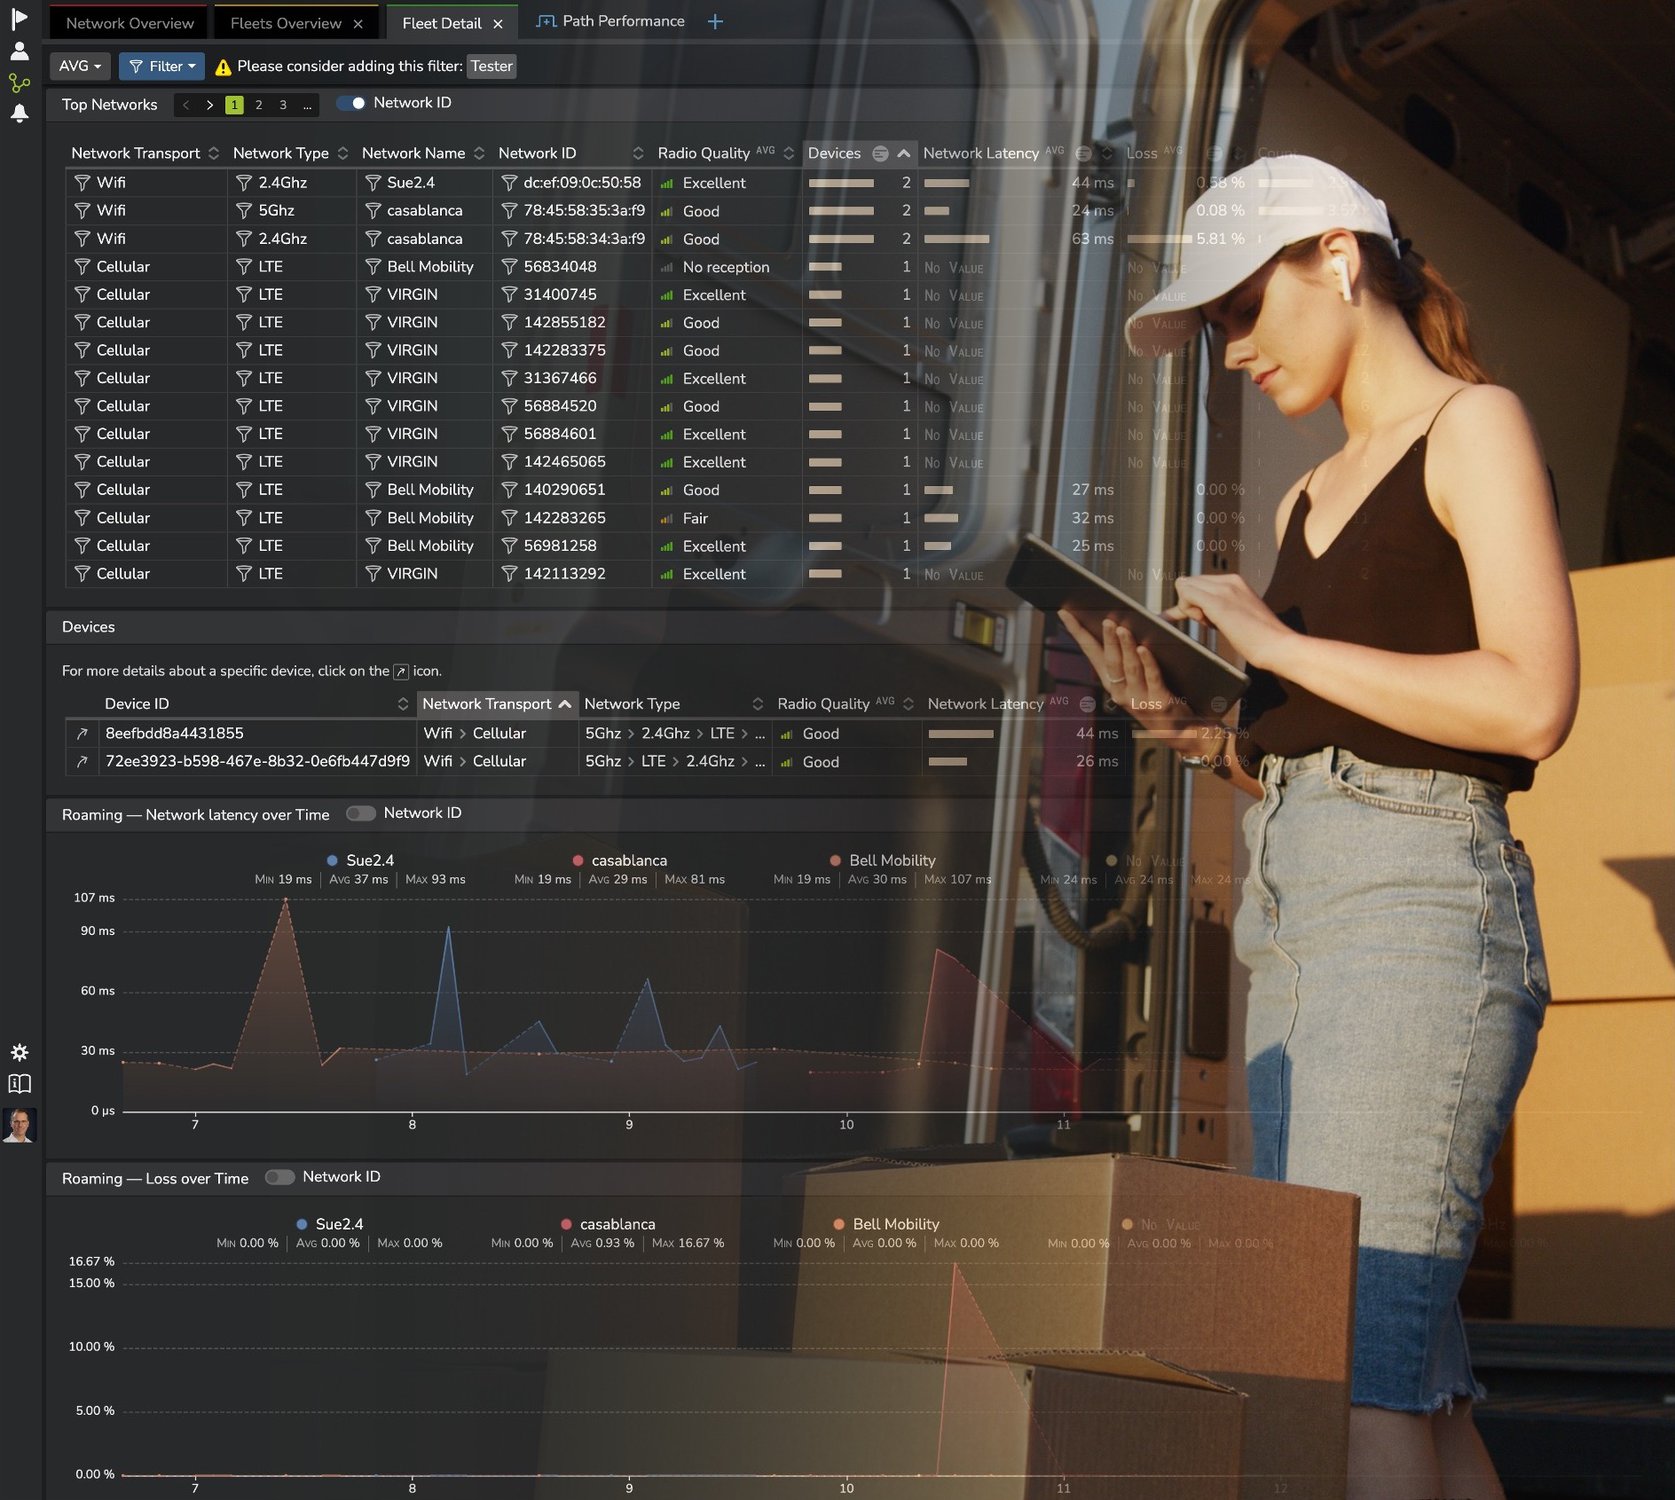
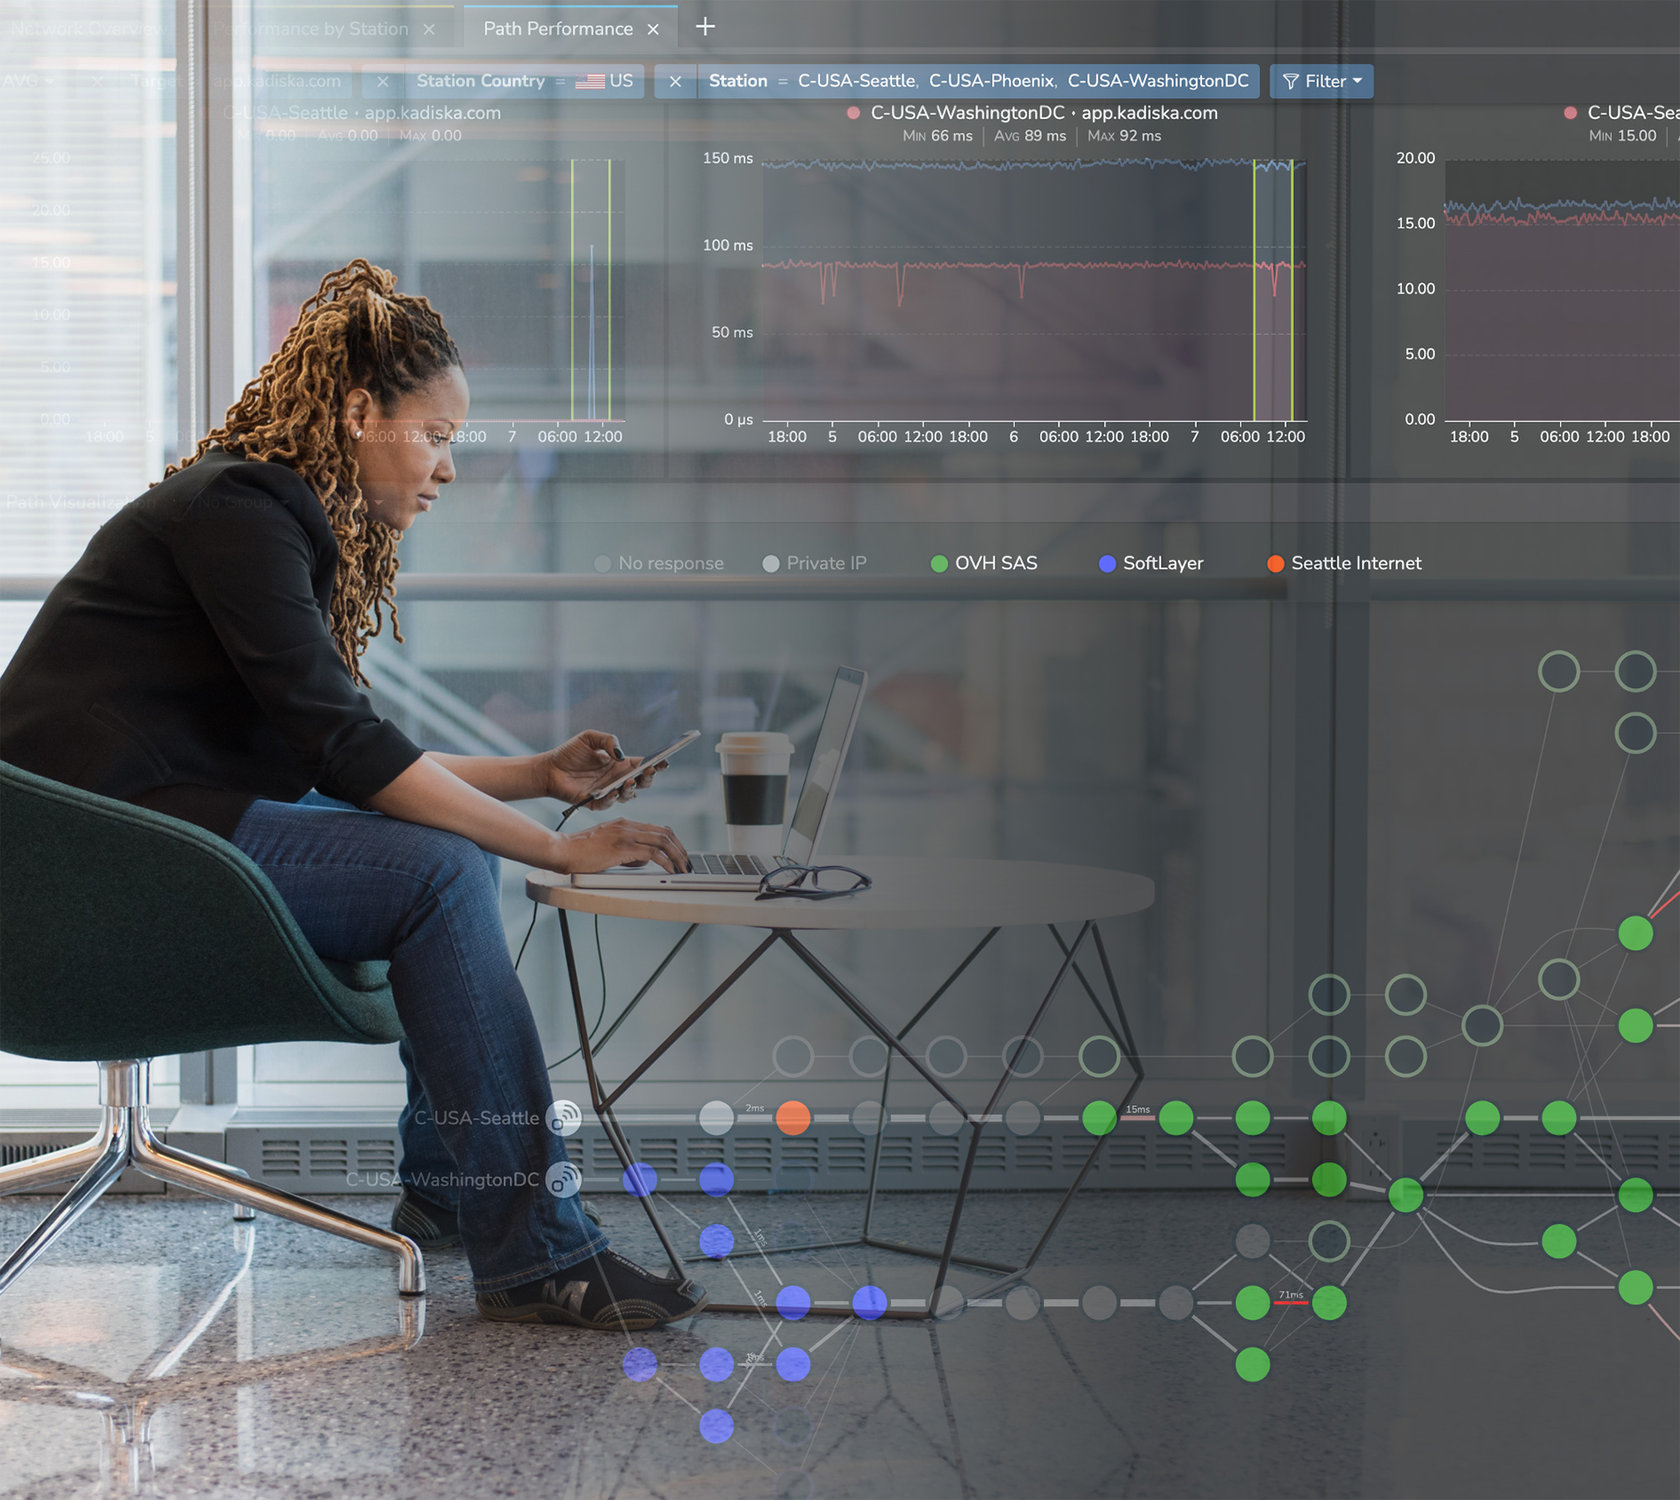
Modern approaches embrace cloud-powered techniques to close visibility gaps, while providing a complete view of end-to-end infrastructure: from application to network to user and their devices. This allows network and IT operations to quickly be alerted to performance degradations impacting SaaS performance, assess the user impact and scope of the issue, rapidly diagnose the layer and location responsible, and verify that it’s resolved.

Instead of relying on a single approach: passive or synthetic, application or network data, modern digital experience and network monitoring tools combine data from multiple sources to get the full picture. By correlating in-depth active network tracing with user experience monitored directly from their browsers the relationships between degradations and the underlying infrastructure is revealed. This agent-free approach is simple to deploy, while overcoming the key challenges associated with server-side instrumentation and traffic analysis.
Learn more about Kadiska’s unique approach to SaaS and web application performance monitoring, and how quickly it can deliver insight in your network in the webinar replay and in these short video demos.