Site Reliability Engineering
Site reliability engineers need network and application performance monitoring visibility that integrates into automated DevOps toolchains

Site Reliability Engineering in Context
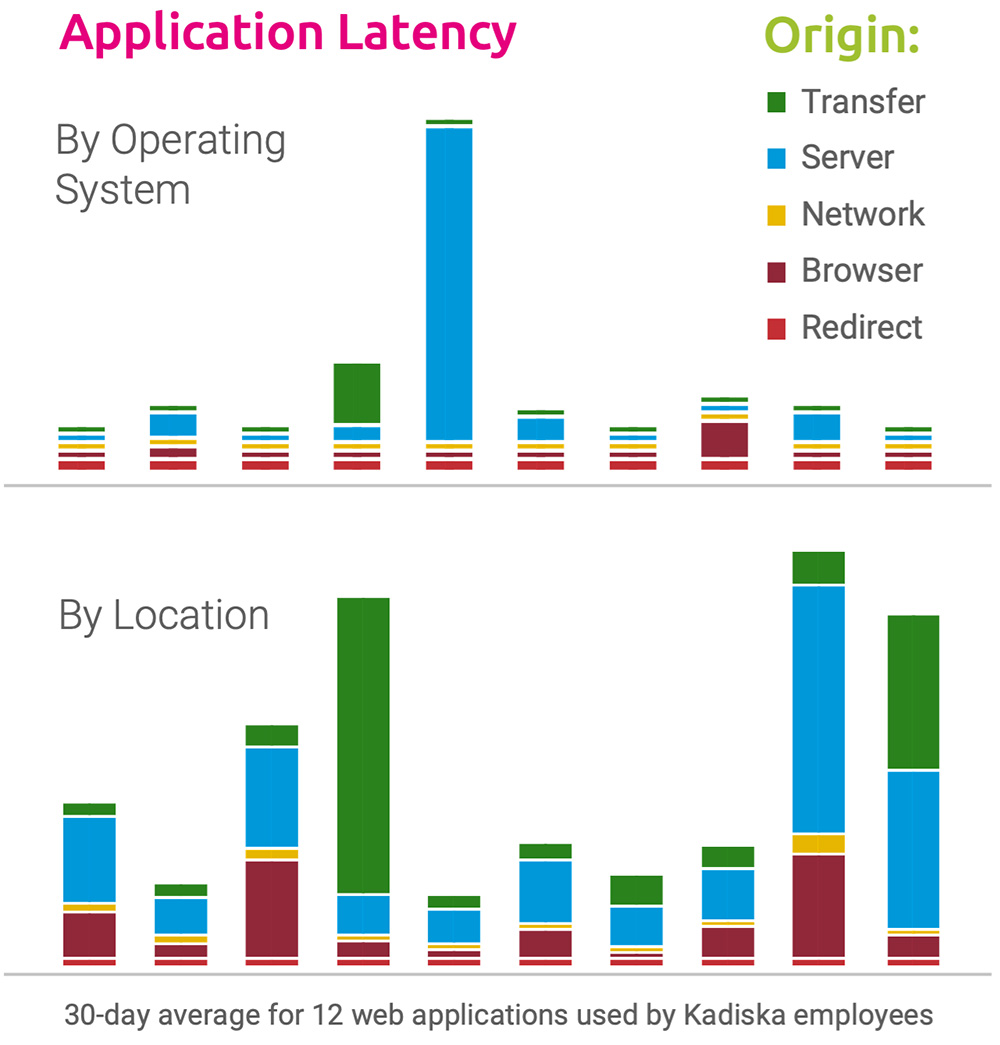
Site Reliability Engineers (SRE) are in high demand. The reason? Site reliability engineering is directly linked to the bottom line. Every second of latency drives 10% of users away.1 How site reliability engineering manages application performance impacts shopping cart conversions, customer and employee retention, site visitors and search ranking. This is why site reliability engineers–and DevOps teams–need to rapidly detect site reliability and performance problems and identify their origin.
Site Reliability Beyond the Cloud
Although site reliability engineers often need to go deep with cloud native observability tools, real user monitoring shows that most digital experience issues are highly dynamic and contextual. The majority of site performance issues originate in the user’s device or browser, because of ISP and service provider performance, and due to connection setup (DNS, TLS) latency and network path issues. To work efficiently, site reliability engineering needs to know which issues originate from cloud infrastructure, application architecture or DevOps release cycles within SRE / DevOps control, and when to hand off to network or IT operations.
Site Reliability Engineering Challenges
Site reliability engineers need to collaborate efficiently with DevOps and IT operations teams to ensure that site experience is optimized, and business-impacting performance degradations are quickly resolved.
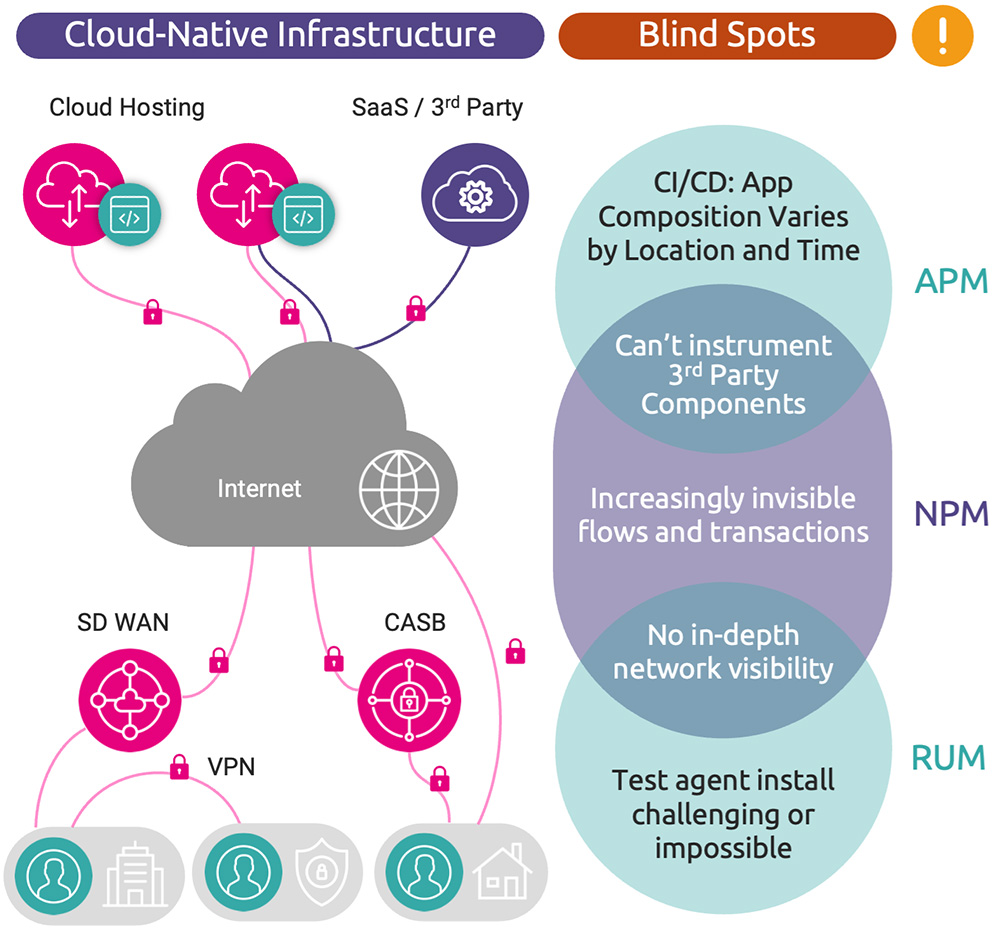
The dynamic nature of cloud-native applications and rapid CI/CD release cycles create a constantly changing reality for users across time and regions. Traditional network performance monitoring (NPM) and application performance monitoring (APM) tools are increasingly blind to multi-cloud infrastructure and networks, hybrid connectivity, SaaS, PaaS and third-party components and their effect on user experience.
The SRE / DevOps Visibility Gap
- Lack of tools dedicated to full stack, end-to-end performance monitoring
- Legacy NPM / APM solutions don’t support automated CI/CD deployment
- Difficult to diagnose issues caused by browsers, networks, CDNs, DNS, TLS and cloud gateways
- Limited insight into third-party extensions, platforms and applications (SaaS, PaaS) and their impact on site reliability
Performance Optimization Use Cases for DevOps/SRE
Site reliability engineering requires dynamic visibility into web, SaaS and hybrid network performance and the resulting user digital experience to architect, troubleshoot and optimize site reliability and responsiveness. Gaining an overview of network, cloud, application and SaaS performance drivers helps guide efficient action across teams, supporting DevOps/SRE activities. Click to learn more about essential test and monitoring capabilities for site reliability engineering use cases:
Automated Monitoring for Site Reliability Engineering
Short, continuous development cycles require monitoring solutions that adjust automatically as the application deployment changes. They need to provide immediate performance feedback for new releases or rollbacks—across all users and locations—without manual intervention. Monitoring solutions also need to identify issues that originate from user devices, network provider and path, or PaaS/third-party services to ensure SRE teams remain focused on issues within their control.
Monitoring for SRE / DevOps Teams
Unlike your traditional NPM and APM solutions, Kadiska was designed for cloud native applications and services. It closes the visibility gap and empowers site reliability engineering teams to deliver an amazing digital experience to customers and employees.
- Understand usage patterns, trends and anomalies (location, volume, transactions, hosts)
- Identify regional degradations caused by service providers, CDNs or insufficient hosting coverage
- Isolate faults across all layers, segments and domains (device OS and browser, network, DNS, TLS, HTTP and cloud locations)
- Pinpoint caching, compression and page load performance issues
- Detect transaction errors and delays to third-party components and platforms
- Receive real-time alerts with root cause insights
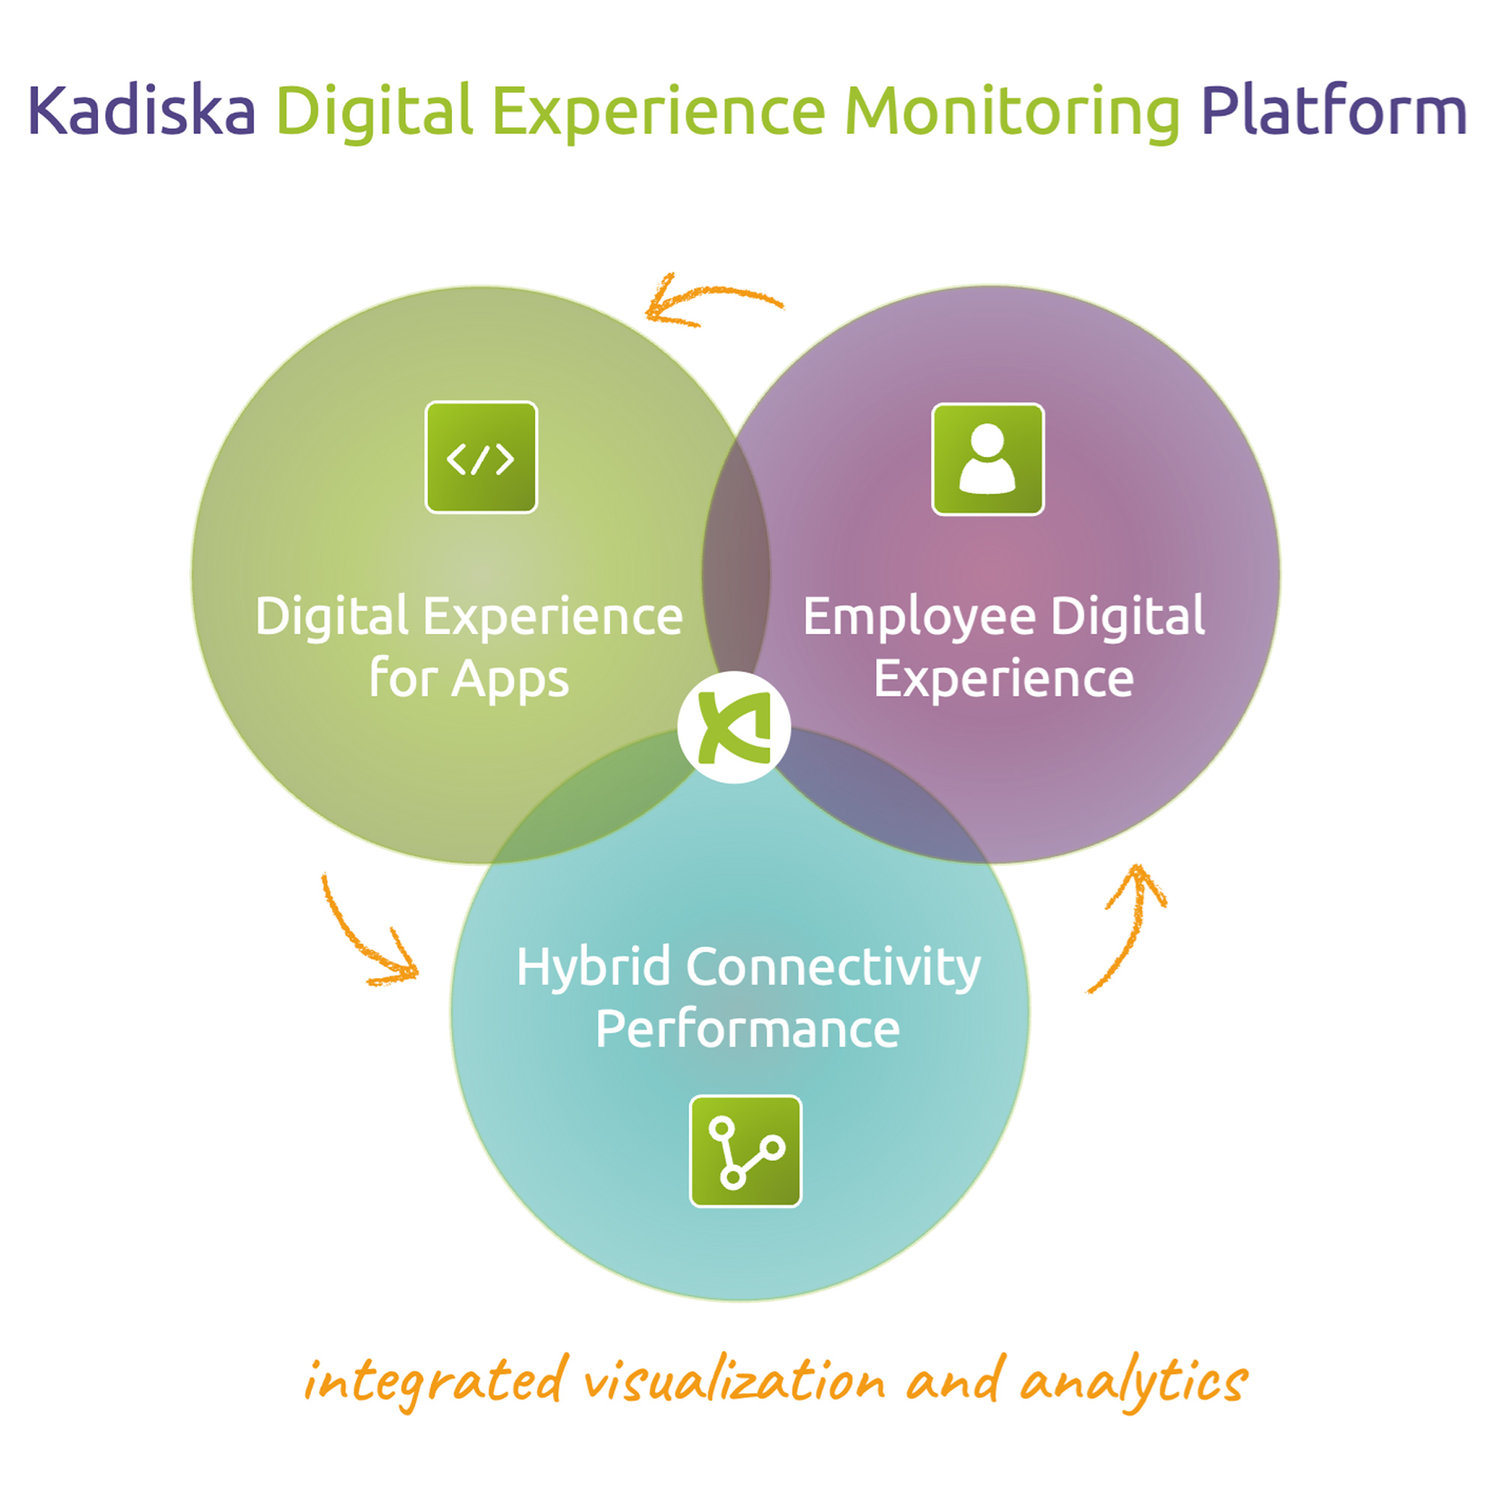
Digital Experience Platform for Site Reliability Engineering
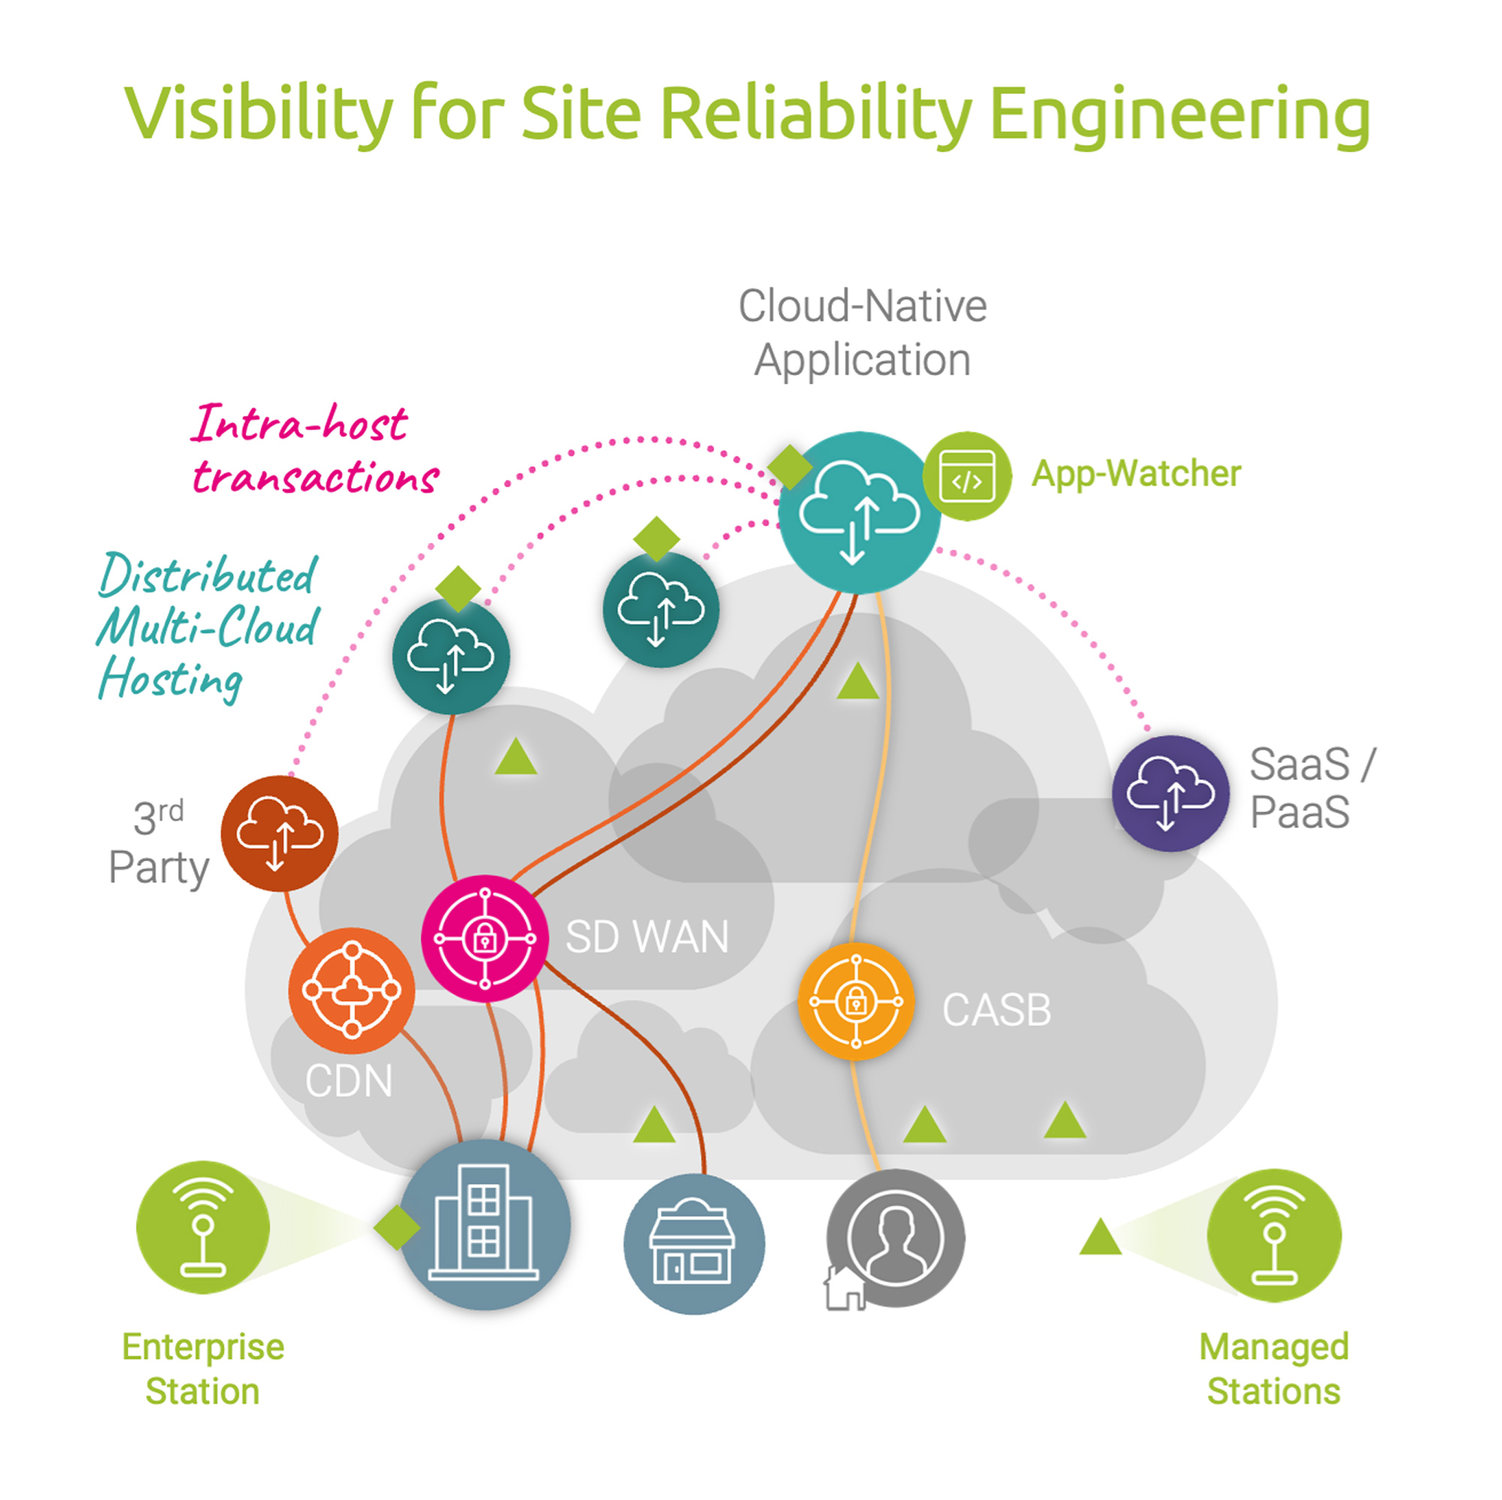
The Kadiska platform combines full visibility into every user, host and transaction, with proactive and continuous network path performance testing from hundreds of locations and service providers worldwide. Benefit from ubiquitous real user monitoring without agents or instrumenting application code.
Our zero-touch maintenance and automated deployment model delivers immediate insight without adding overhead—so SRE teams can focus on getting things done instead of taking care of tools. Open APIs allow seamless integration with existing DevOps toolchains, reporting and observability platforms.
Benefits to Site Reliability Engineering Teams
Gain a 360° view of infrastructure performance and user experience:
- Accelerate performance and user experience optimization across SRE / DevOps and IT operations teams
- Rapidly isolate the origin of degradations across all layers and infrastructure
- Gain 100% visibility into every dot-release across every host, service, cloud and region
- Cost efficiently scale up and down monitoring without managing complex licenses
- See site reliability and performance from all locations users work from
Learn more about the Kadiska Digital Experience platform.


