Watch this short video to learn how to quickly fix Chromebook issues with remote performance monitoring that identifies Chromebook network and application problems and their root cause.
This demo video relies on simple monitoring components that can be easily installed on Chromebooks through the Google play and Chrome web store.
Save time and resources spent on troubleshooting across the full end-to-end path from Chromebook to SaaS applications across Wi-Fi, internet, zero trust/SASE and cloud networks.
Video Transcript:
Boris Rogier: I think Chromebook is both specifically not that specific as anyone working from home or working branches using the internet to reach SaaS applications and using security solutions around that, like cloud proxies and CASB is just going to be affected by the same thing.
So if you think, you know of the whole journey from a user to the cloud, there are so many traps from a performance standpoint. A, it’s hard for someone to guess where problems actually come from. I’ll show you live, when we think of experience, it’s going to be driven by many factors.
It’s going to be driven by very local. Networks like wi-fi and the land and which the you use and what is your IP and what is the last mile. But then you’ve got things that sit really in the cloud, like CASB and zero trust networks and VPNs, and potentially as the one as well if you see in branch somewhere.
And then there is where. You are getting redirected by a SaaS platform and the cloud. So the first thing we’re going to show you is the digital experience and what drives it and how simply we can make this, obvious. And the second will be and that’s part of the digital experience for that, for the digital experience is the hybrid connectivity.
So what is the path you take when you want to reach a certain service and how does it affect your experience?
Okay. There are three sources of information that we use to to show you data.
The first one is User-Watcher. It’s a very lightweight instrumentation of your browsers. So basically you place an extension on your browser and you can deploy that industrially on all of your devices: Chromebooks or any device that has a browser. And the second one will be net Tracer which will basically be deployed on Chromebooks specifically as an Android app.
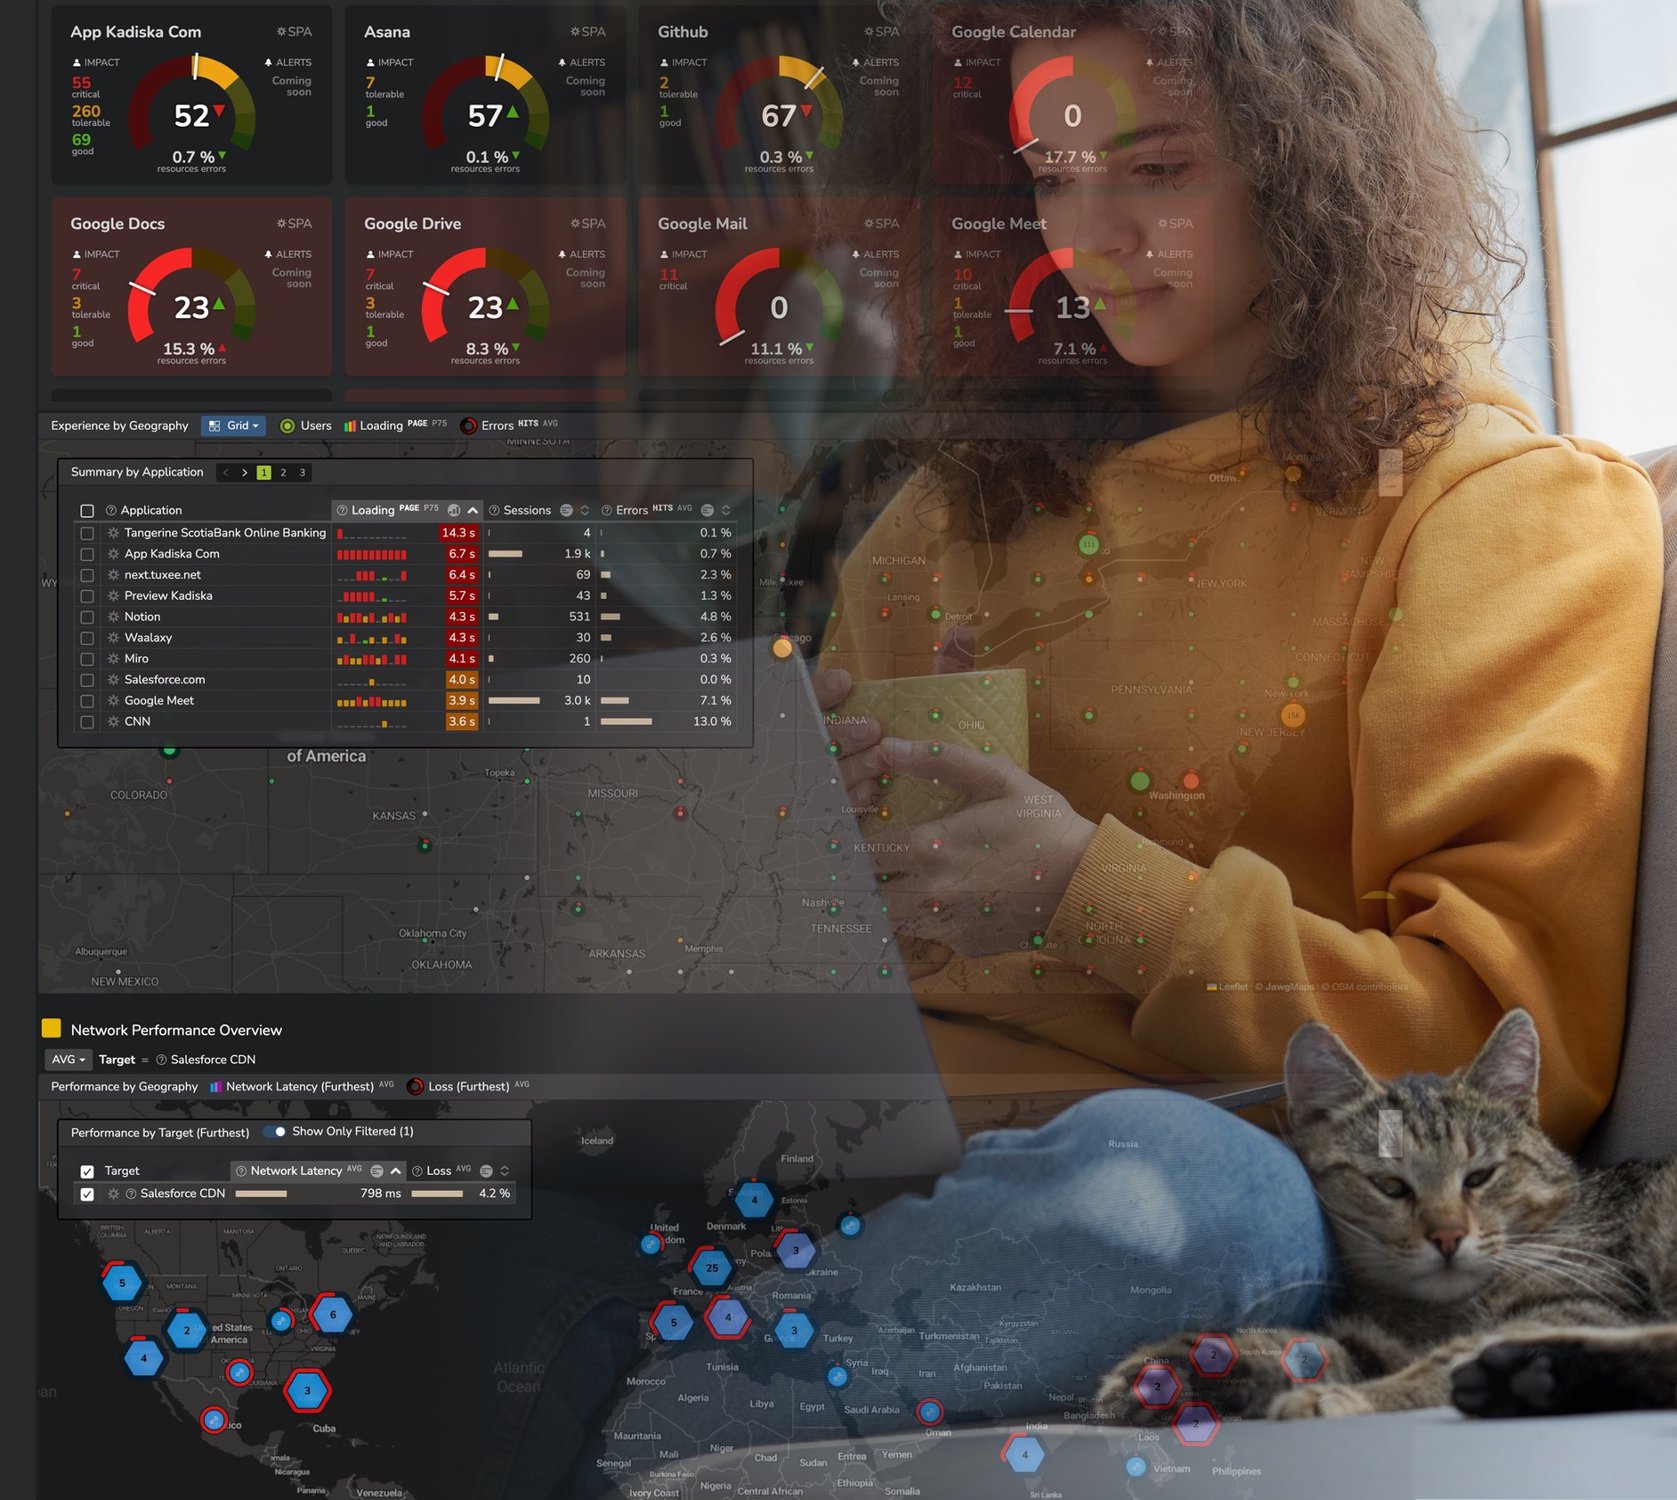
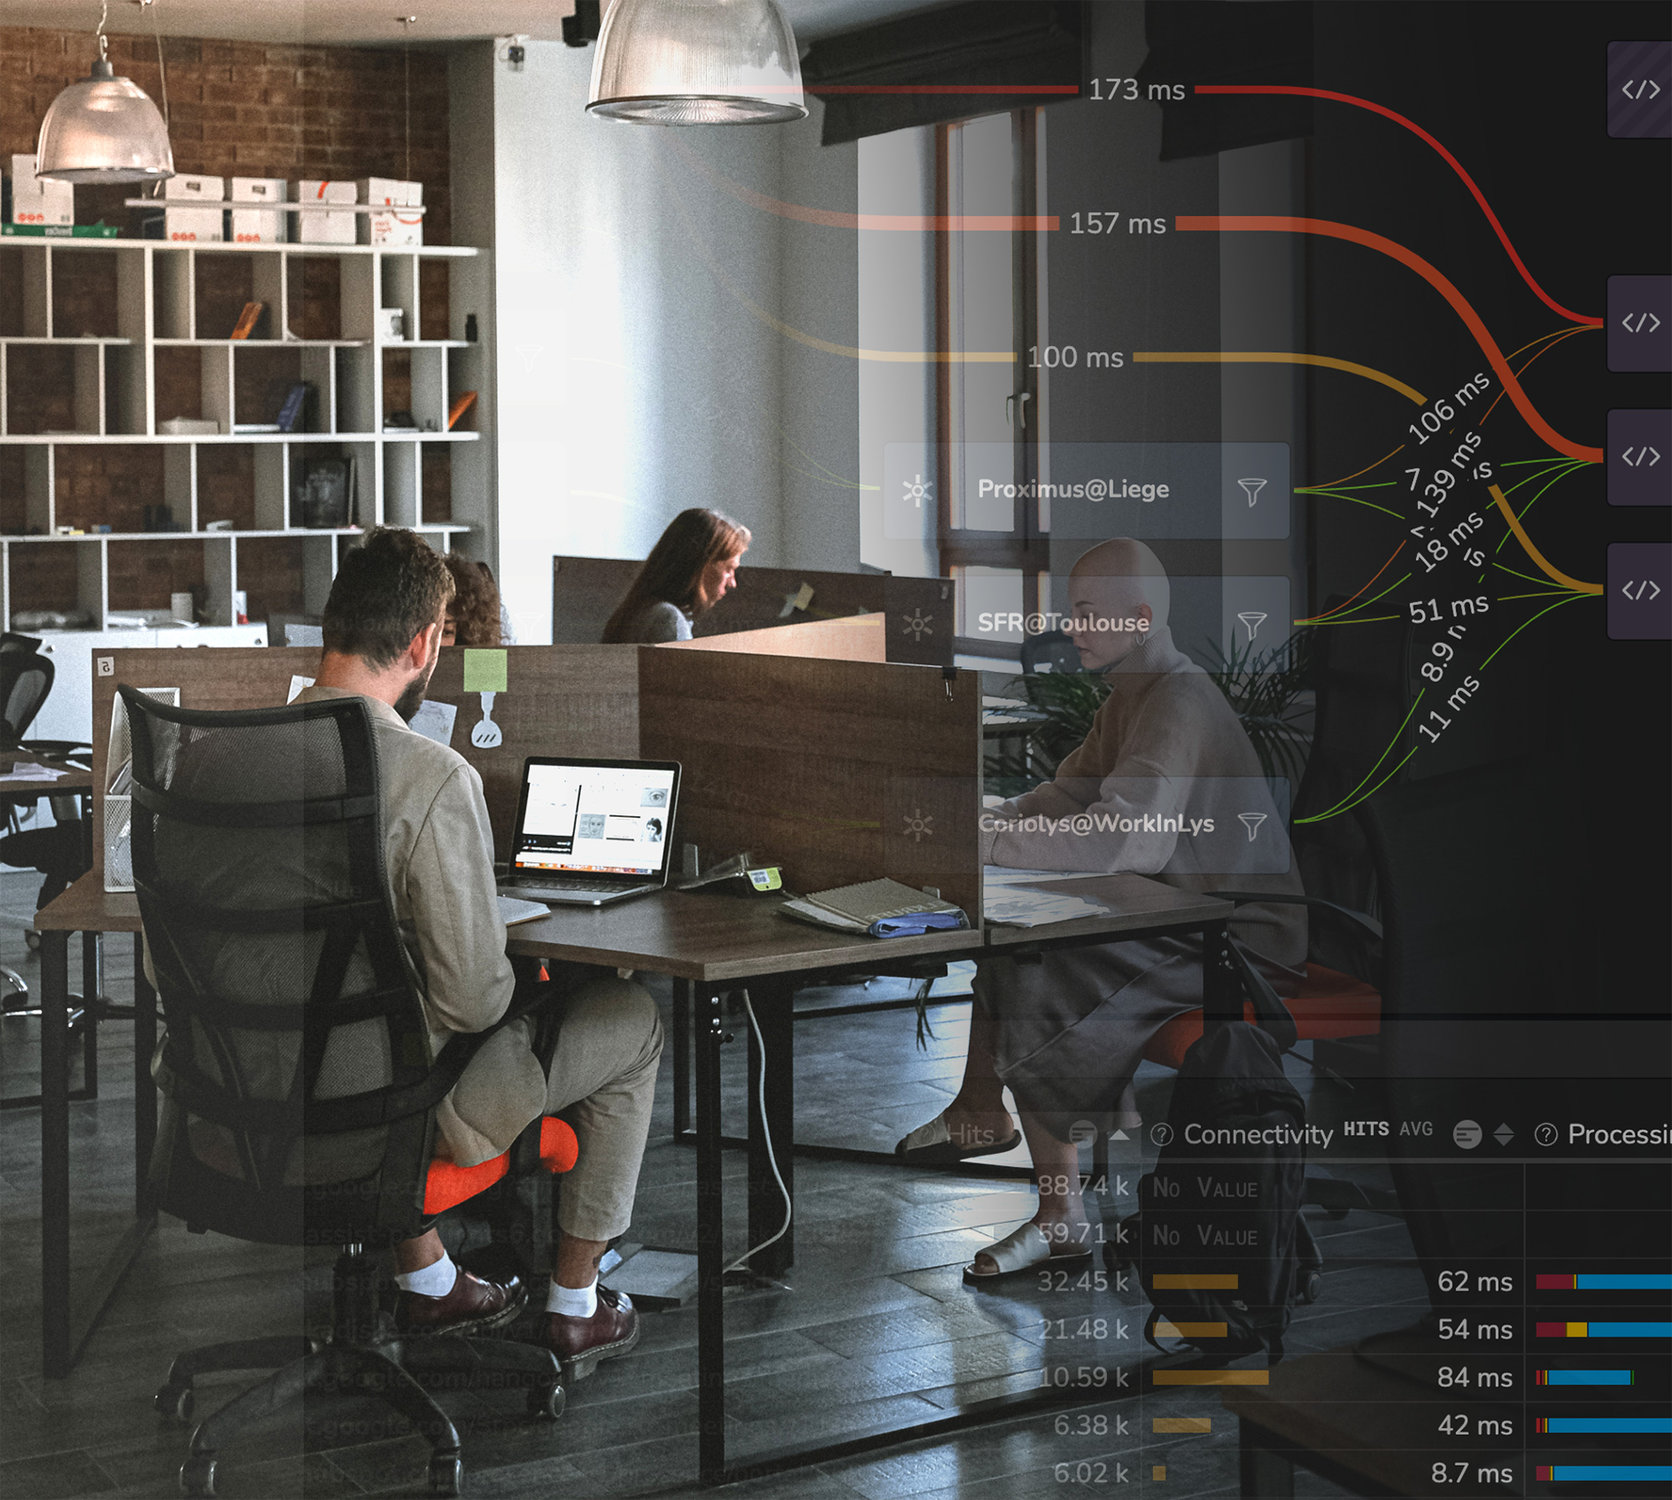
Here are the outcomes and the insights we can get from it. So I’m looking at, three days of our own team performance and digital experience. So we can see the different applications that are used. How many people actually connect to those applications? What is the connectivity?
You can see that as a figure, or you can see a trend and basically see how people might be affected, by changing conditions when they want to reach a certain application. I Good example, that would be Asana, which is the task management SaaS application we use internally, where you see latencies is changing and then you see directly indicators of user experience.
So either the time, which is to load a new page or the time needed to make an API process. An API call. So we call that API processing, and that can be broken down between the different infrastructure layer that are going to influence, the restaurant assignments that you are getting. So here you see, for example in red the waiting time, the network layer, DNS and latency are going to be represented in yellow.
Blue is going to represent the server processing. So how long the sales server or the application server is taking to respond. And green is going to. At the time, transfer data back to you. Which may be short, but may be long in some cases. Google Docs is a good example. And then you will see the number of errors that might affect your users.
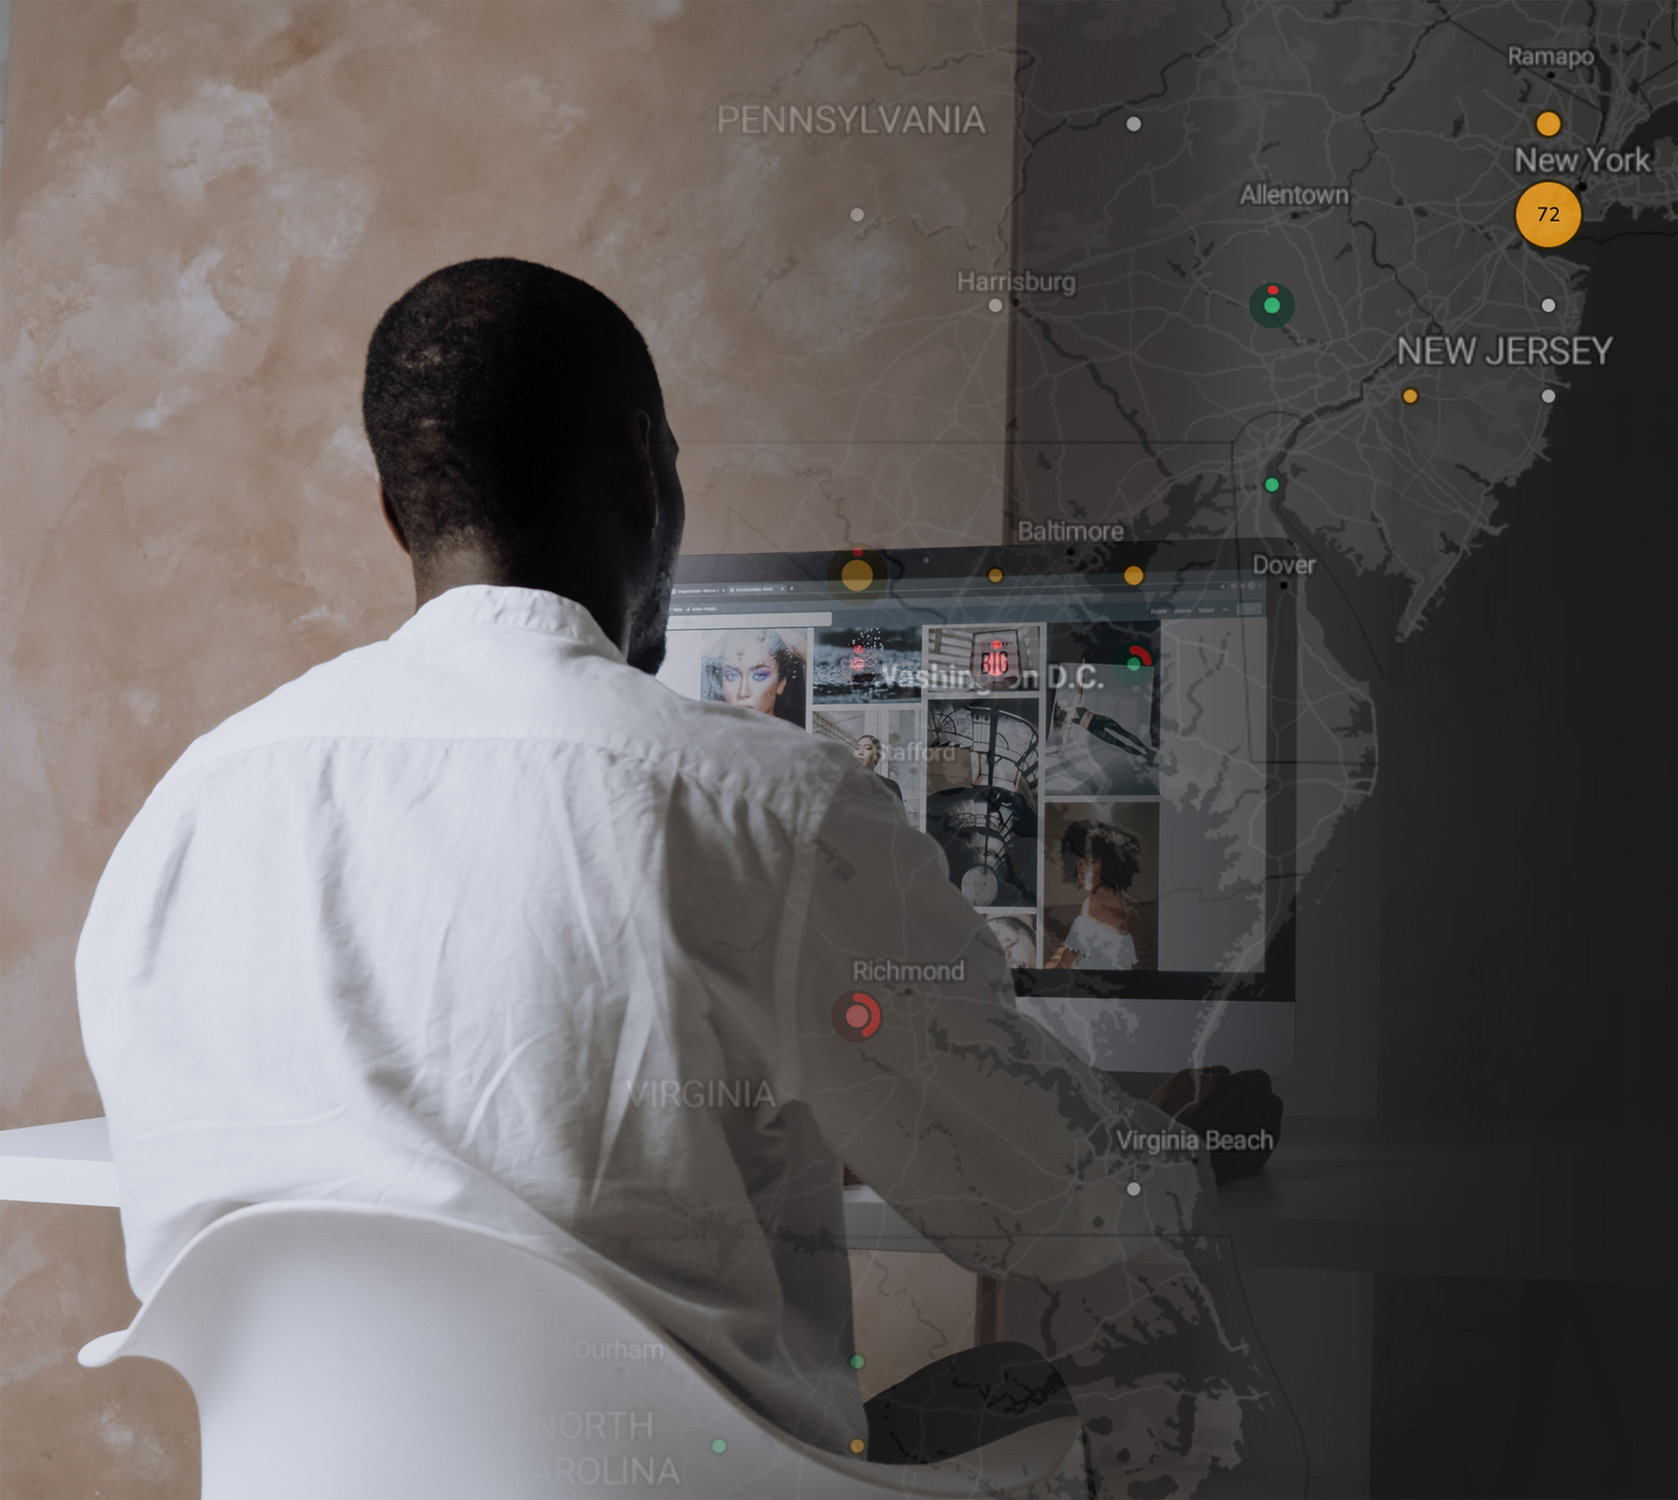
The idea is that you, you get a, basically a high end view of that which application stand not so close to the users. You know which ones have experienced problems, you know which ones are affected by errors, how to glance, and then you can see your users on the map and. Where are the users that have trouble?
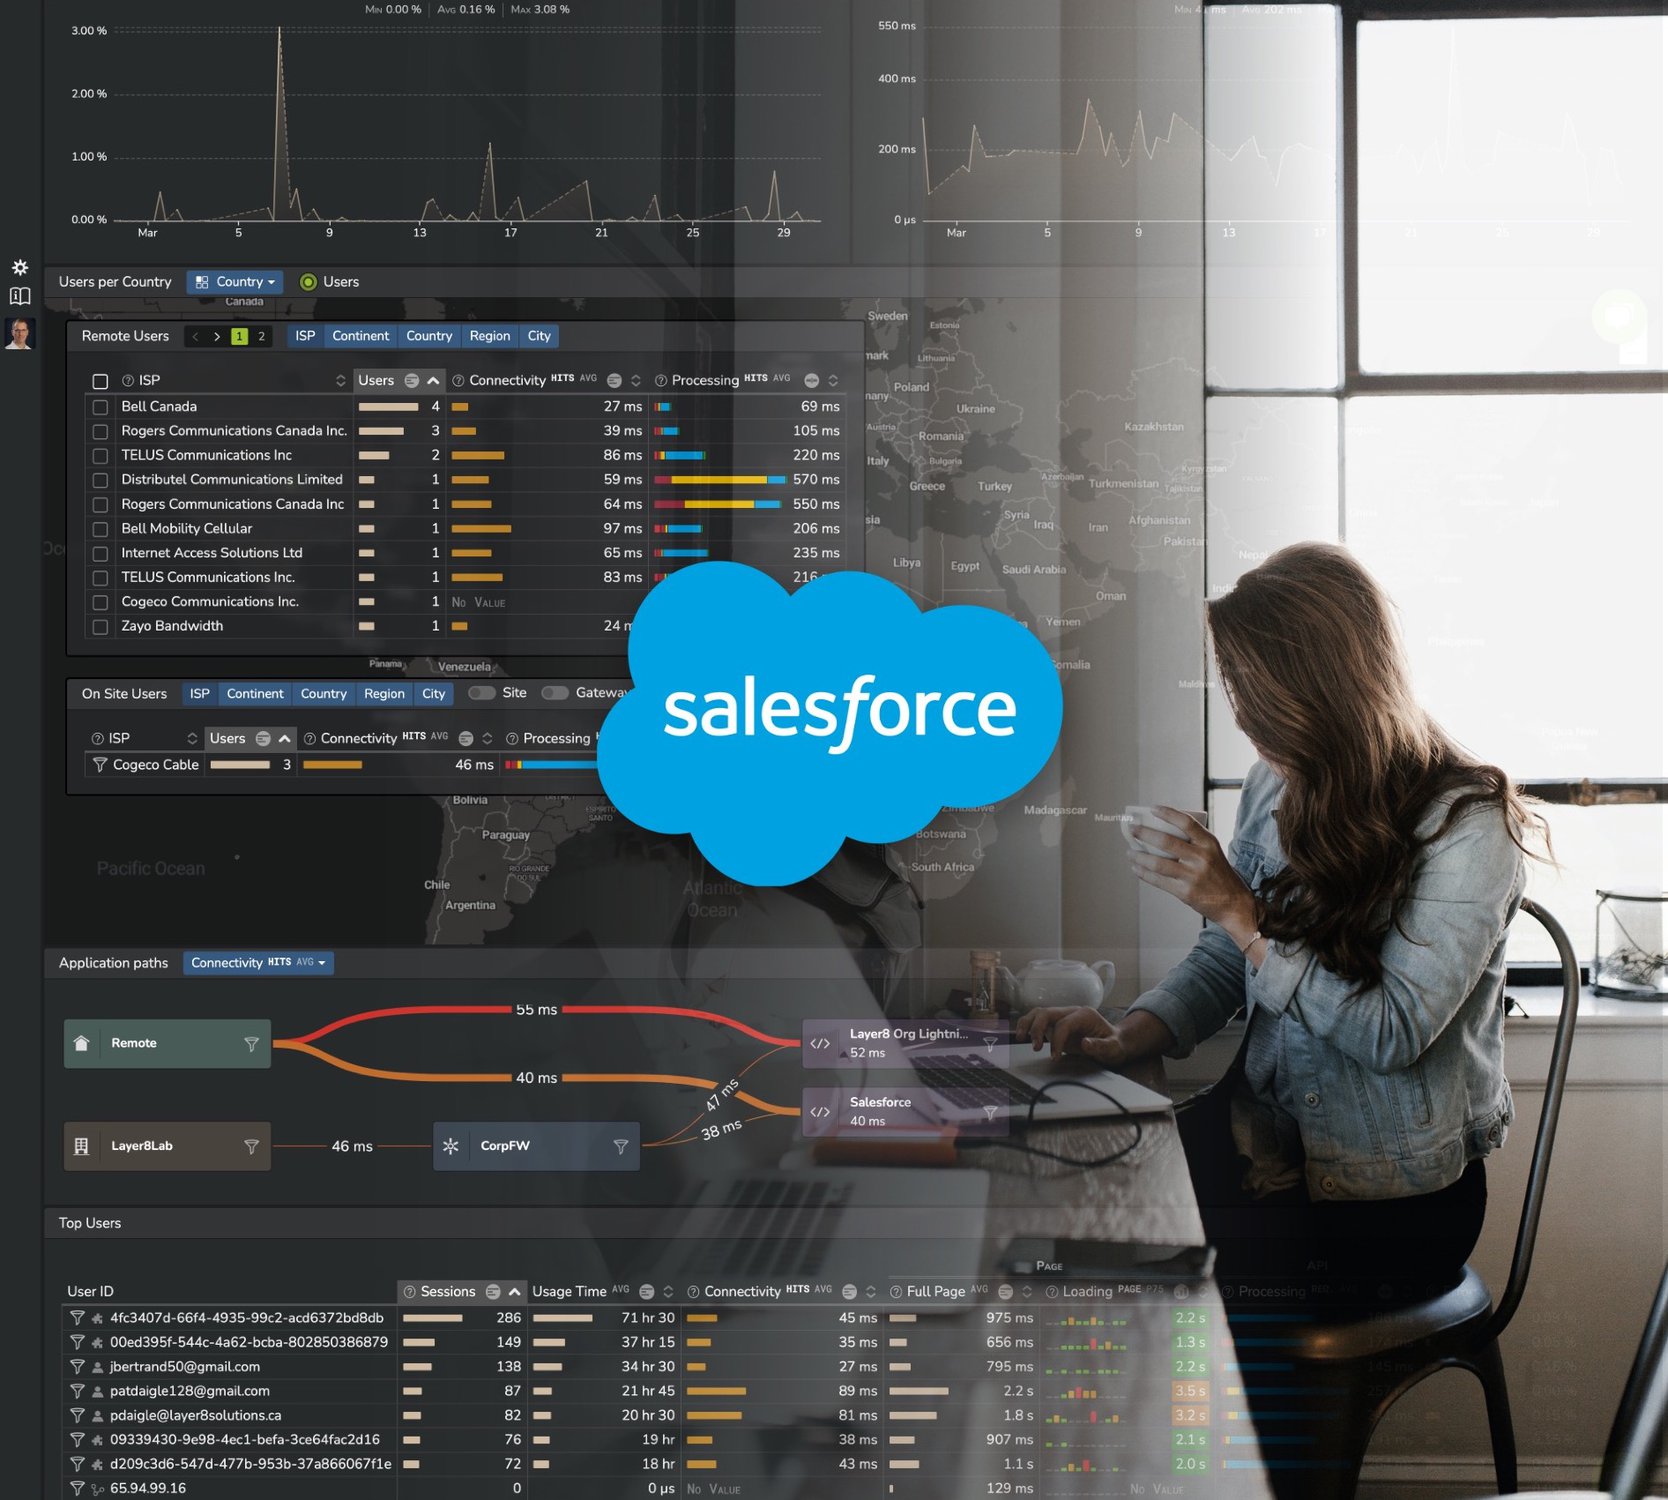
So for example when we look at page load times, it’s obvious that the people in the western part of France have a much worse experience than people sitting in Canada, for example, in Montreal. And then we can see people by either their location. Or the internet service provider they’re using to connect to different applications.
And there are are some obvious things. For example, the people using a Zero Trust network like Netskope or Microsoft zero trust network, don’t get good latency that has a direct impact on their experience. And people using Orange probably inference will have a worse. Okay. So you can see that by country if there are some people sitting on site and not working remote, you can see them as well.
And you can see the breakdown of those users also by the kind of endpoints they’re using. So you see, we’ve got a mix of Windows users, Mac users, Linux users, and of course Chromebook users, which is topic for today. All right. If you want to dive into that. Nothing is simpler. You just. Application and you get to a little more details as to what are the trends from a restaurant time standpoint, the number of users when there are basically times that are response signs that are getting bigger or error rates that are getting bigger and Woo is affected by that.
We’ve got 21 people, for example, coming from the Microsoft Zero Trust Network. And for them latency is bad and that has a direct impact on their experience. While we see that all the technologies used, like Zscaler would probably prove to be good we can also see people on site.
We can see that graphically and see where all the people going to when they use Microsoft zero Trust Network, for example. We simply filter on that and we see that they are going to the Scap platform, and we can see a list of users that are impacted. Okay. If we want to take another example we could simply say, okay, I want to know who’s impacted by this pick of response sign.
That would show me directly which applications are impacted by that. I would know that Google Calendar, for example, Tremendous transfer time, a lot of errors. I could see that the people impacted other people on site in Montreal, and I could tell you exactly what is the past debt checking and why they had such bad impact and who was the user, and I could eventually tell you, okay what application does that user actually accessing?
Where is he connected from? Which application is he using? Where is he having trouble? I could tell you whether his had a pick of latency, for example. So his his DNS, for example, went really bad. He was always on site. I could tell you if he if he RAM or CPU at some point, okay. And say that he is got a connectivity problem.
The thing that. Probably I’ll be willing to know is why is having connectivity problems. And basically that’s something we can tell easily, from Chromebooks. So we’ve got two groups of people using Chromebooks on our platform. Some are located. In Canada, some allocated in Belgium.
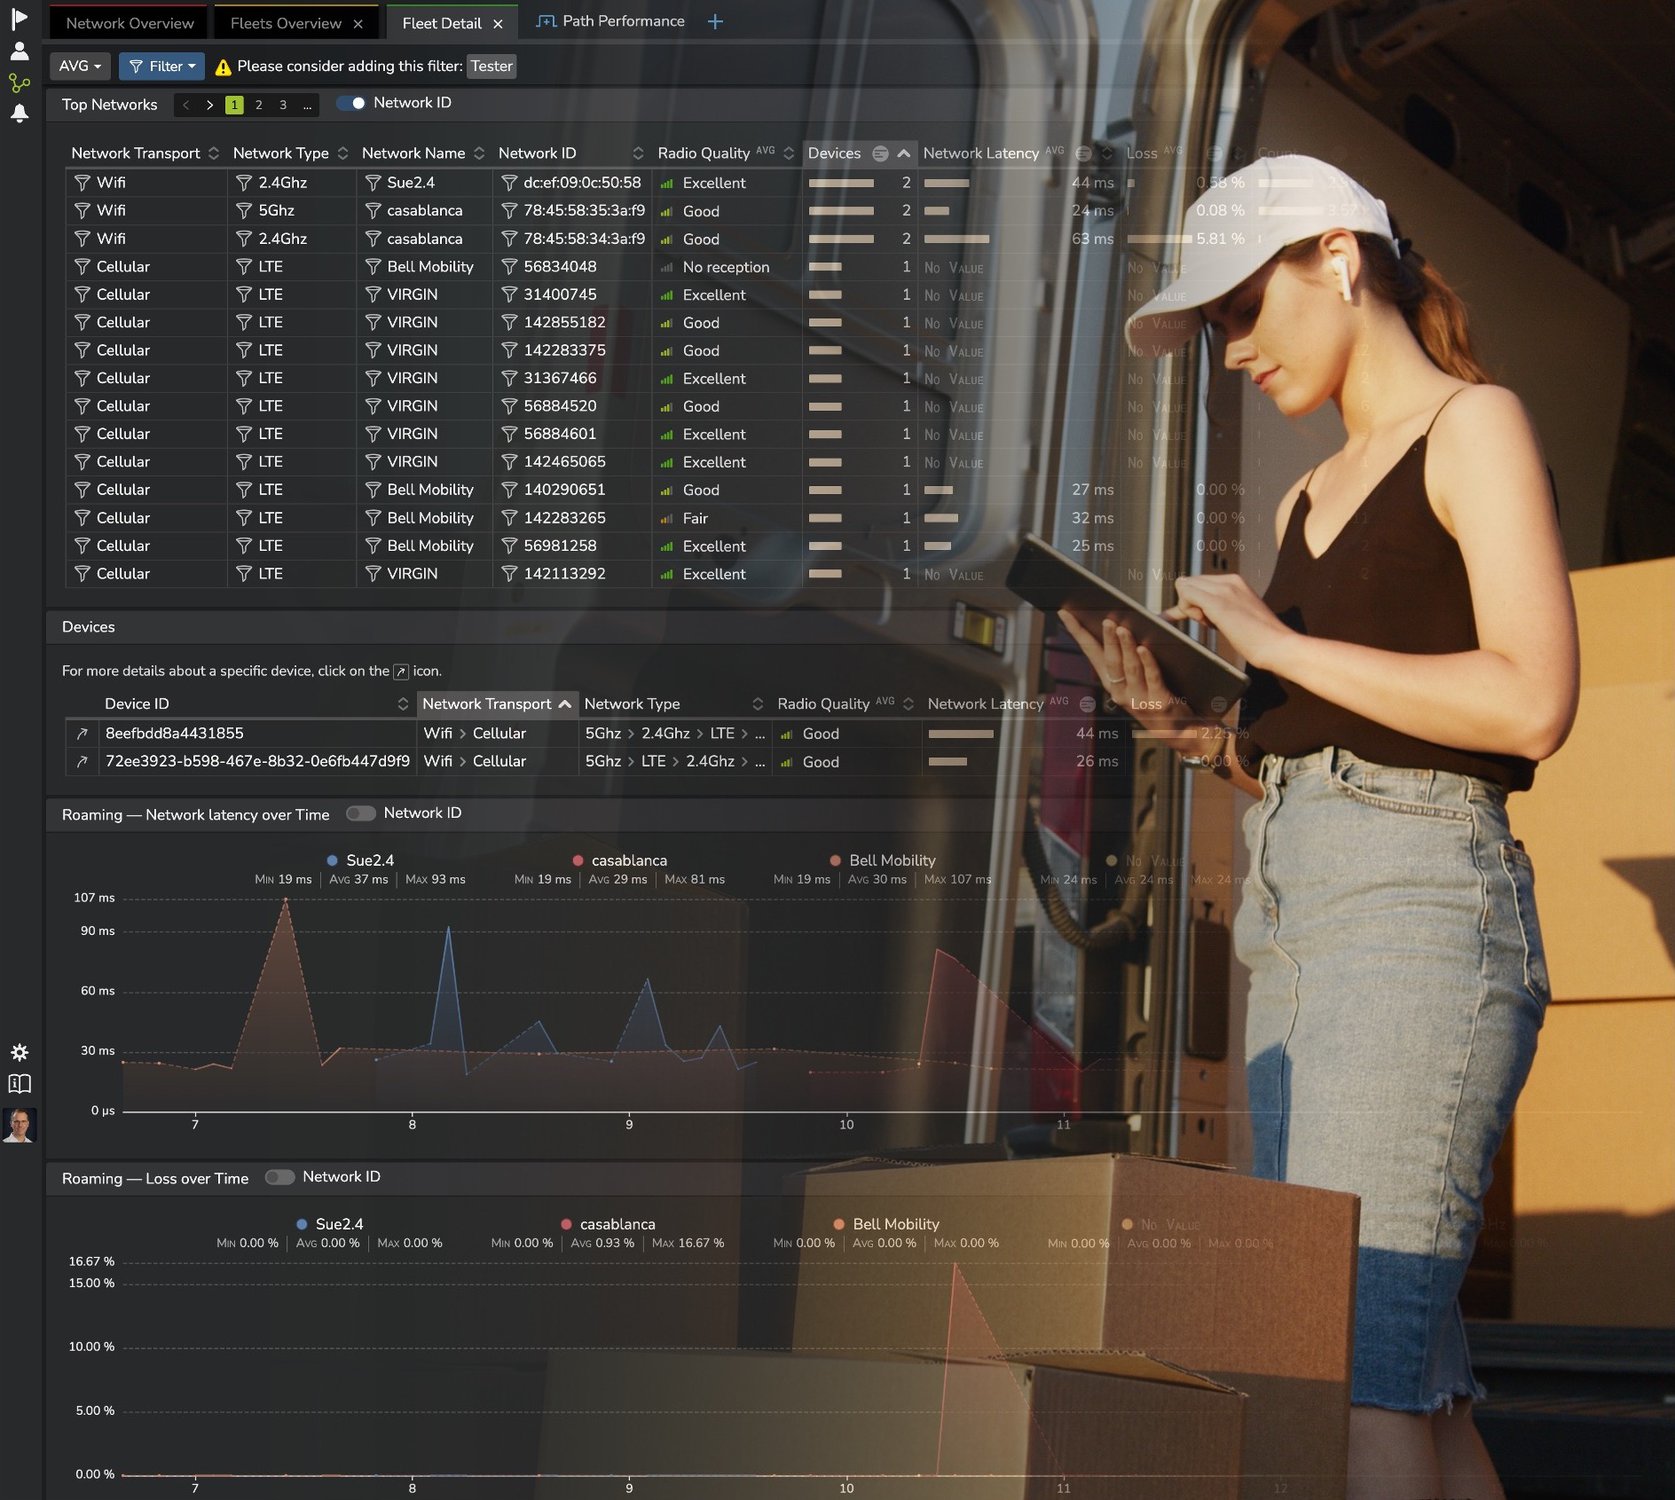
We can see which part which services they’re trying to reach. We can see that, for example, they’ve got problems with the Microsoft Media server and lost two. The media server so we can deep dive. Go into the different fleets of Chromebooks. So some are belonging to our Montreal office.
There are five of them. Some belong to the Belgium office. There’s just one of them. We can see the latency and the laws they’re getting. We can see where they’re trying to get to what are the services that they’re getting, what sort of quality of signal they’re getting on the wi-fi, how it affects, the.
The quality. If we want to look into, for example, one fleet in particular we would go to Montreal and we would see basically all the wi-fi and connectivity services used by Montreal. And we could see, for example, that the people suffering from loss are connected through the wi-fi, which is called Casablanca on the frequency, which is 2.4 GHz.
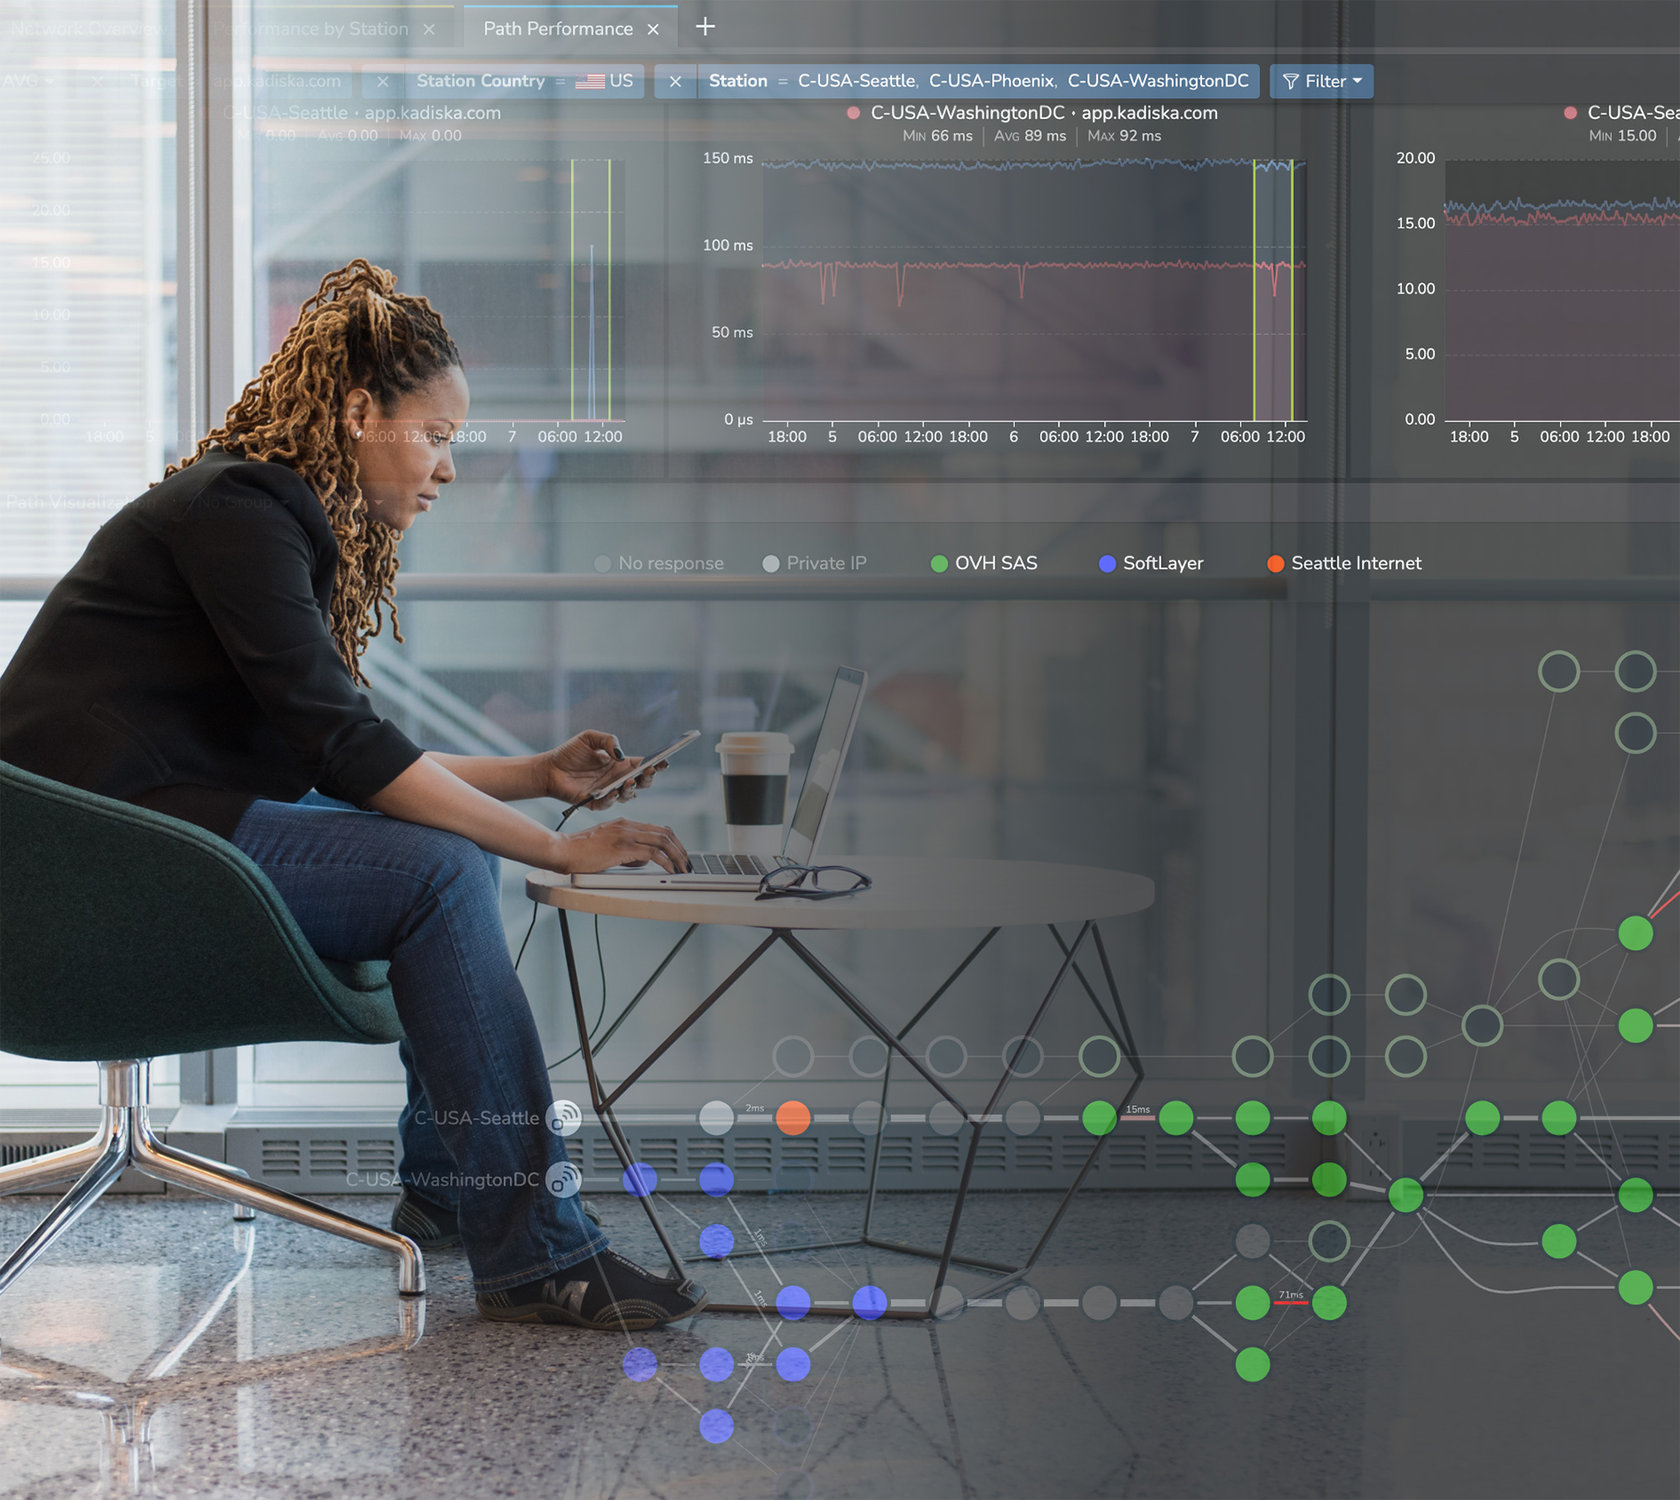
And we can focus on this one for example. As an example, then see devices, see which one have good signal pull signal which ones got affected, and then we can see basically how they connected, when they were connected, when they suffered from loss. And in the end, the goal is that we can get to the point where we see which bus they’re taking how they reach the media server.
And basically if there is packet loss which is the case. We can see where it’s happening. So if it’s happening in the private network, on the wi-fi on the last mile of the operator, all like in this case on the Microsoft to Zero network.
It’s all the different passes basically that you can take. So we’re looking at seven days. So obviously when you go through a cloud network, there are plenty of options from a pass point of view in a cloud network. So if our restricted time, you’re going to actually see exactly what pass disc book was take, taking, at a given point in time.
And that will tell you exactly where loss is happening at a given point in. .
Scott Sumner: So this is what’s varying over. If you think you have a stable wi-fi at home, for example, and you’ve paid for a premium one or at the office, something else is clearly going on beyond your wi-fi, that’s varying all the time, right?
So this is what this is trying to tell you is you can find why your performance is different from one day to another when your configuration hasn’t changed at all.
This is actually pretty cool. What we’ll do in a second, we’re going to look at that bit more. As it loads. It’s a very complex network that we’re analyzing here, going into Microsoft’s Cloud network. But what Boris will show you is where the loss can actually come from, and often it’s latency originates from something outside of the Chromebooks control.
Boris Rogier: correct? Correct. I It can be simply something that last can happen any at any point in time at any place on, on, on the network path. So it can belong to the wi-fi, it can belong to your last mile operator. If you are running on an SD one, it can. Basically come from one underlay or another.
And there are possibilities for you to to to work around that. In the same way when you are affected by loss, for example, in the cloud service, if you know where it comes from, you can actually take action and get another DNS resolution to be redirected to another SaaS node.
Scott Sumner: And also I guess if you’re the network operations guy, this tells you very quickly that your network itself, though you’re in control of, is working very well, including like the wi-fi connectivity to the end user’s, Chromebook. But in this case you have to have a conversation with Microsoft if that is where the loss is coming in, right?
So it really saves you time because you understand right away. Where the responsibility lies, whether you should be working on the device, upgrading it to make sure it’s behaving properly or the wi-fi or the i s p or so. This is a pretty good tool to understand have a good conversation, right?
Boris Rogier: Correct. You can manage multiple vendors in a way. Your ISP, your cloud provider your zero address network provider.