


Kadiska recently introduced Net-Tracer support for Android mobile devices, already deployed by some of our largest retail customers. Reflecting this new capability, we have introduced three new dashboards dedicated to Android fleet monitoring. These allow you to more easily navigate from a fleet’s health overview, up to details related to specific devices.
This video provides a quick introduction to these new capabilities in the Kadiska platform:
Please refer to our online documentation for more information.
Video Transcript
In this new product release, we have built three new dashboards that are related to the Android fleet management. In the previous version of the product, you had only one dashboard, which was called Android devices. So you had a lot of information in this dashboard and you were able to filter on different things to get more details and to perform some drill down analysis.
Now we made sure to ease the process by providing first an overview of the different fleets and applications you are targeting from these different fleets. Then you can go into more details about specific fleets. And then finally you can even go into the details of specific devices. So from the network overview dashboard, you have a new suggested dashboard, which is the fleets overview.
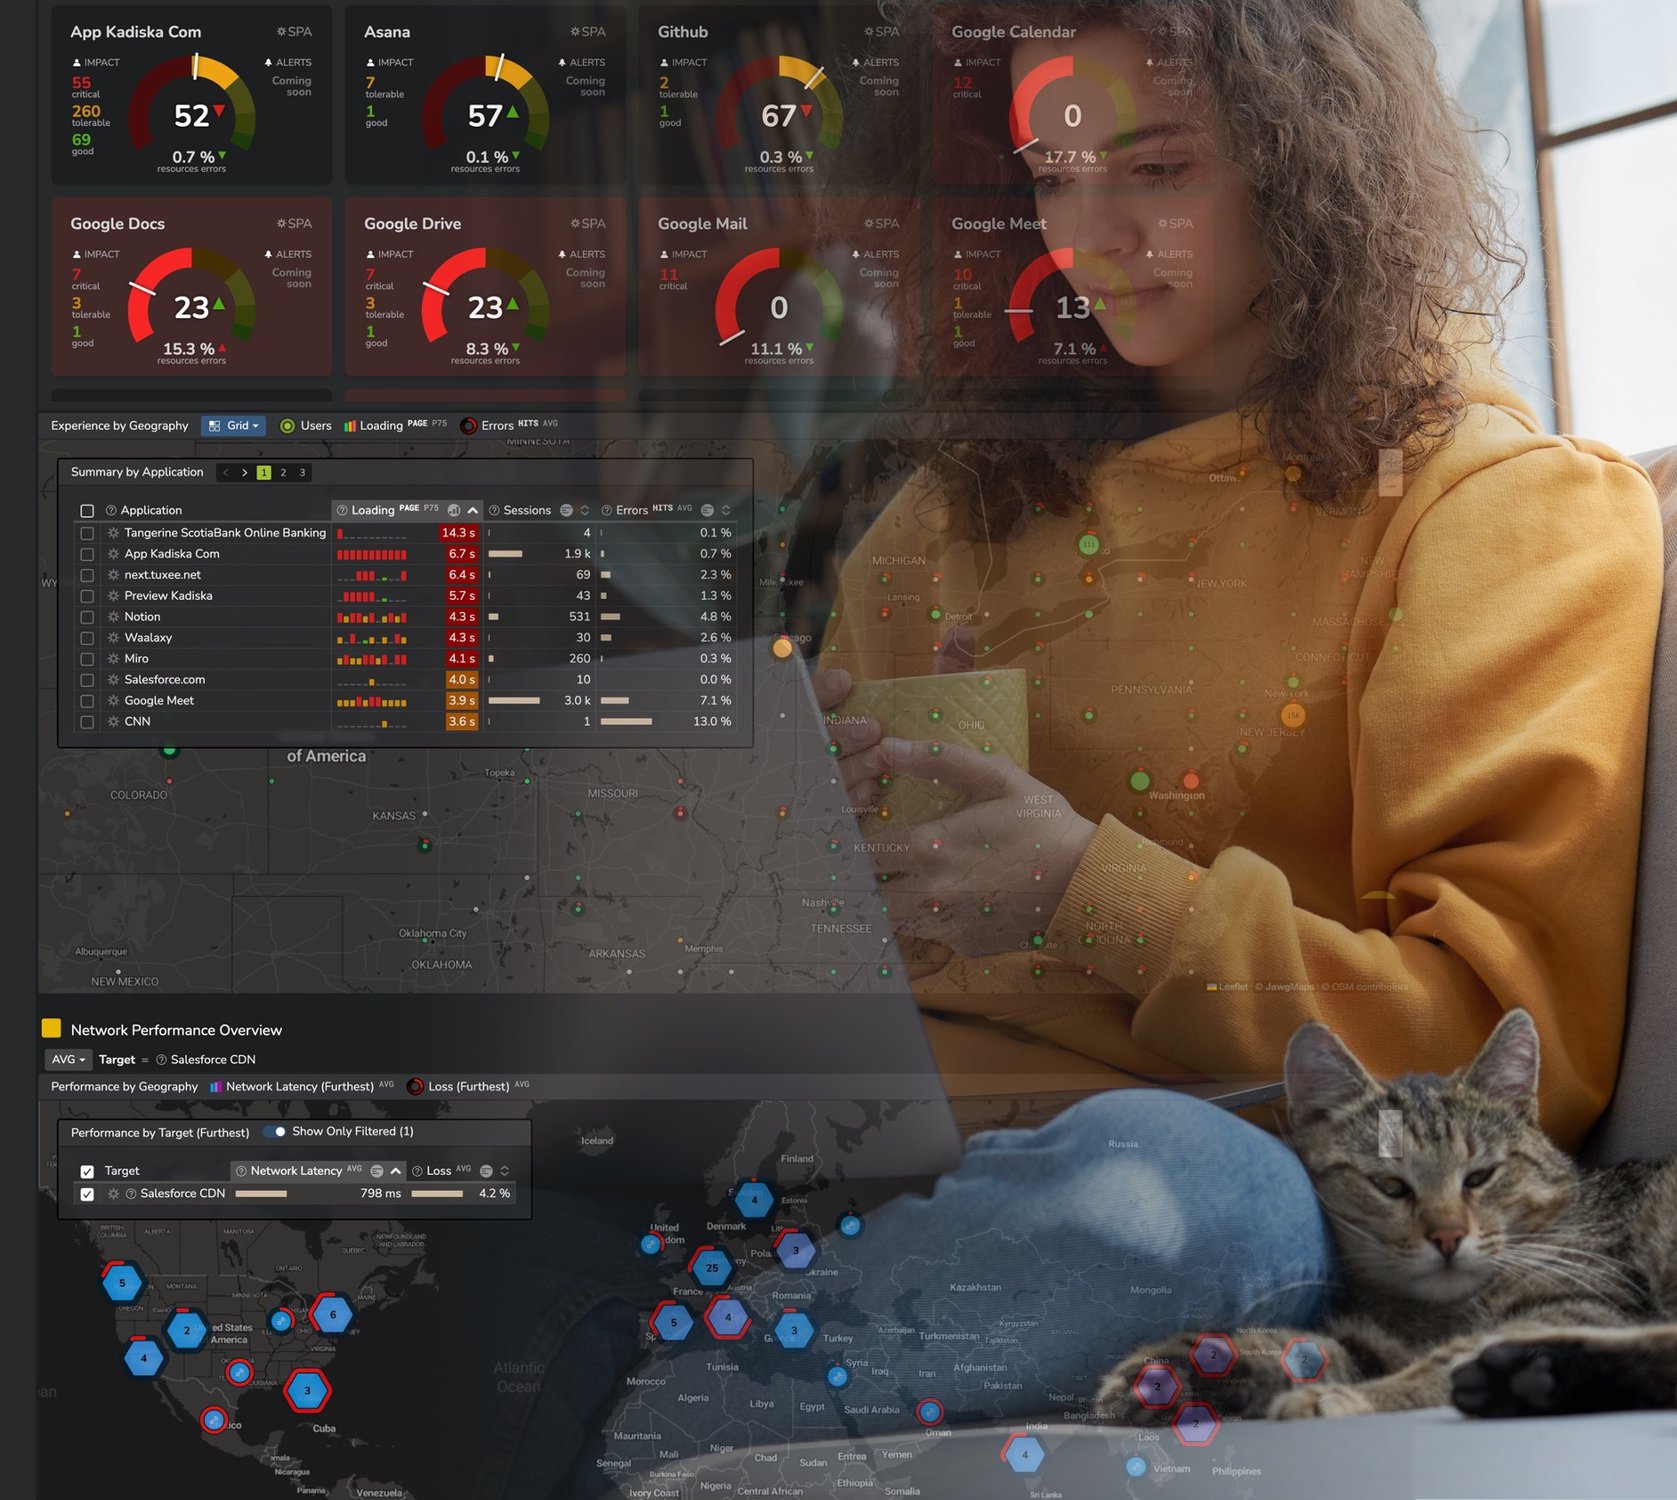
So if you click on the fleet’s overview, you have basically two types of information. The first one is what we call the top fleets that provides the health of the different fleets connecting to the different applications. So you see here, for example, one fleet with five devices targeting all these applications.
You see the evolution of the time of the network latency targeting these different applications as well as an average radio quality information that relates to the different Wi-Fi and 4G, 5G networks, the different devices in these specific fleets are connecting to. Then you have the top applications, so the top Net-Tracer targets you have configured for these different fleets with every time the number of devices that have targeted this application, the radio quality average evaluation, as well as the network latency evolution over time. From these two tables you are able to quickly identify any fleet that would be mainly impacted by degradation or specific application that would suffer from that connectivity from all the different fleets.
As usual, if I do want to focus on a specific fleet, I can simply select here the filter so that all the information on this dashboard are automatically updated.
Now the next step, if I do want to go into a little bit more detail about specific fleets and the devices and the different local networks they are connected to, then I can simply click here on the arrow or I can select it and navigate to fleet detail.
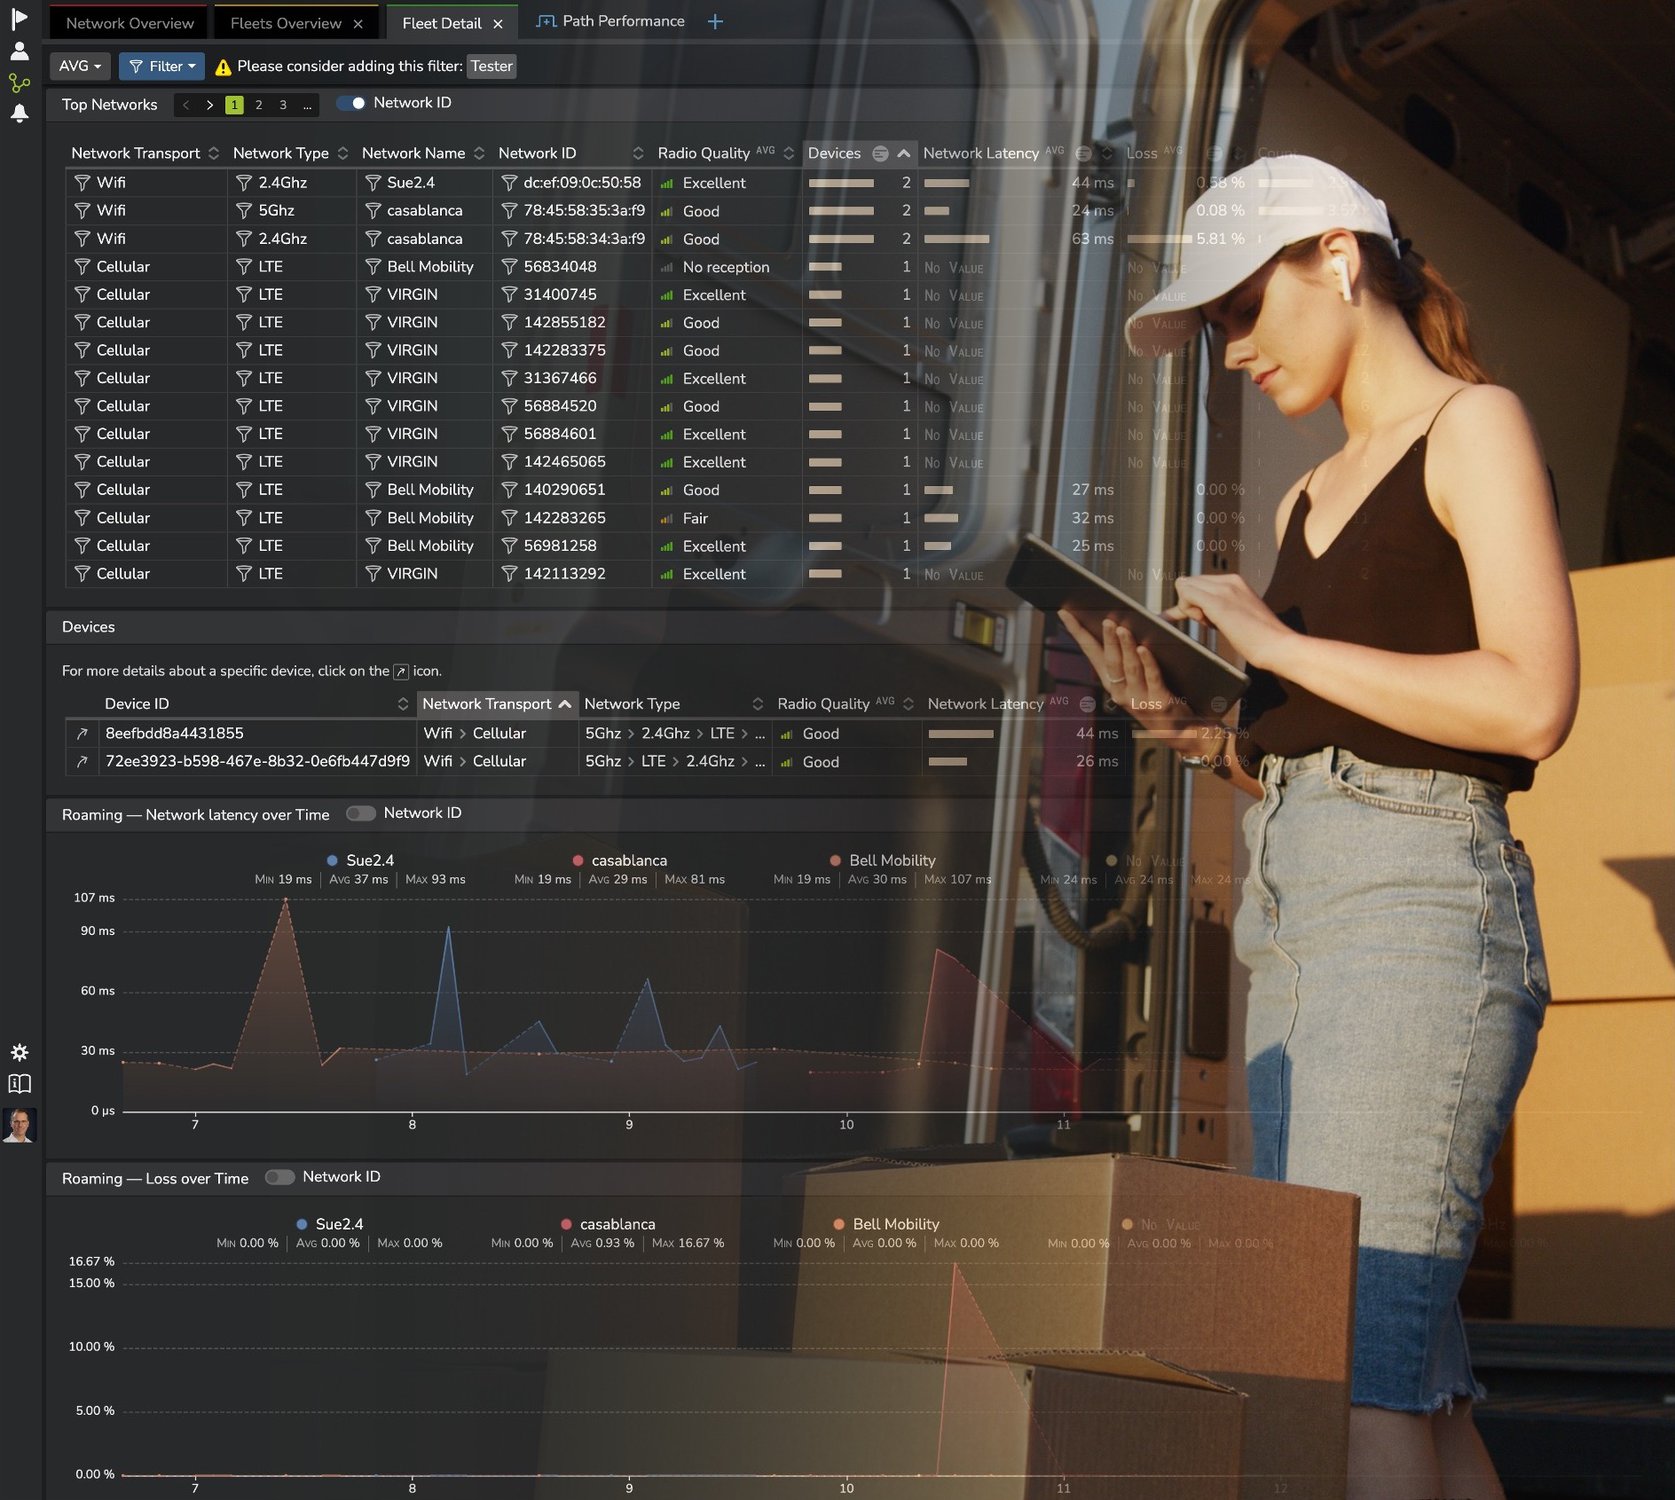
But the easiest way is to quickly click on the. Then here I have the fleet detail dashboard. In this dashboard for this specific fleet, I have the list of all local networks the different devices have been connected to. So for example, here I have a Wi-Fi, 5GHz called Casablanca. The radio quality was excellent and five devices have been connected on this Wi-Fi.
Again, I can quickly click on the Wi-Fi so that I can focus, for example, on only the W iFi local networks and see here the evolution of the time of the network latency as well as packet loss if I’m interested in. And then also the number of devices that have been connected to these different networks.
I can go into more details. So here, for example, I have the network ID so that I do not have only the information per Wi-Fi network, but also per the SSID, so per access points, so that I can identify quickly whether one specific access point did not deliver good performance. You see here again, the number of devices that have been connected on the different access points, the corresponding network latency, targeting the different applications I’ve configured as Net-Tracer, as well as here the counters related to the number of Net-Tracer tests that have been performed from this specific access point.
Now from this view, I can even go into more details and focus on specific devices. So you see here in the table the list of the different devices that have been connected on the different networks here above. Each device is identified by the corresponding international mobile equipment identity, IMEI, so that if a specific user is complaining, for example, about a bad performance, I can really focus on the device this user is using. So here, let me focus on this device, for example. Simply click on this arrow and I navigate automatically to the device detail view.
In this device detail view, you see the successive local networks this device has been connected to so that I can really understand what happened. And for example, here you see that I was connected on this Wi-Fi. Local network, Casablanca 5GHz. The network latency degraded suddenly, and my devices moved to another network.
So here I can really easily understand the connectivity context of specific devices and see if some roamings have had an impact on the overall network connectivity performances.
Learn More
Learn how Kadiska’s mobile app can uniquely monitor Wi-Fi and end-to-end network performance from enterprise Android devices.