


Kadiska has introduced a new application performance scoring dashboard for all monitored applications. The scores are based on Apdex, which is an open standard used to calculate the application performance index for both single and multi-page web applications (SPA, MPA), which are identified automatically by Kadiska.
Apdex takes into account three types of user experience levels: good, tolerable, and critical. Kadiska calculates Apdex scores based on API call processing time and loading metrics, and takes historical data into account to determine whether an application’s performance is improving or degrading. The scope of degradation is determined by the number of users by category. Click on the related zone in the application score widget to access the application dashboard, Apdex score, API call processing analysis page, and resources analysis dashboard to analyze resource errors.
Troubleshoot and Optimize Application Performance
Watch the watch these expert led webinars to learn how to troubleshoot and optimize the performance of your SaaS, web and cloud hosted applications:
Video Transcript
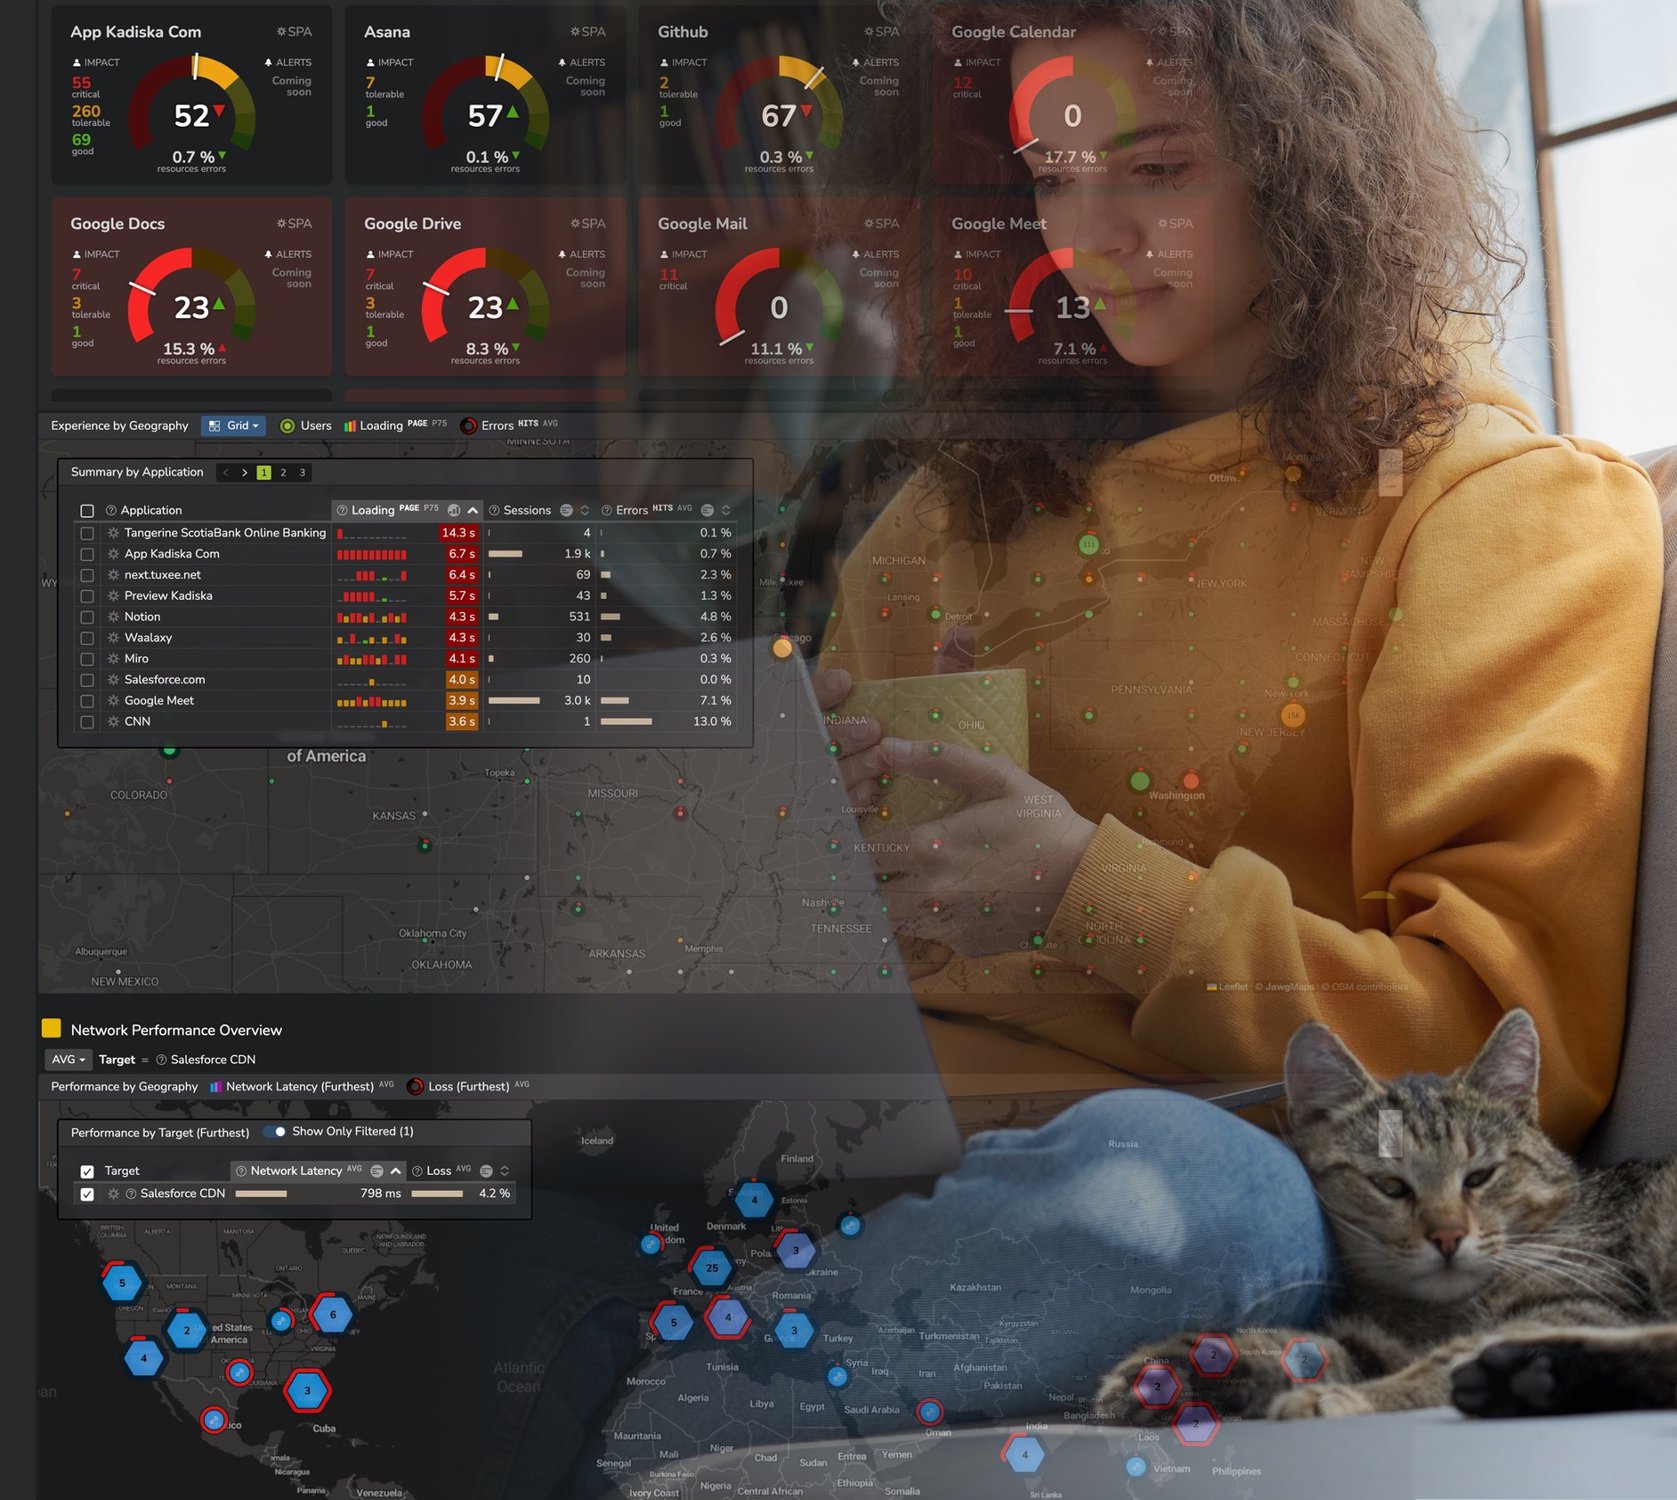
In the latest product release, we have introduced a new main application performance scoring dashboard. This dashboard is the first view you see when you connect to the Kadiska platform, and it’s reachable by going to the homepage. The dashboard shows you all the applications you are currently monitoring.
These are sorted by default by their name, but you may want to sort them by performance so that the most degraded applications come up first in the list. For that, you can simply select this sort by performance option, and you will have the most degraded ones first. First. You may also want to look for specific applications, for which you’ll have the search bar available. In my case, I will look for Microsoft Teams, so I look for MS, and I get it here right away.
By default, you see that each widget provides only the score. Of the application performance, you can have more details, but just simply fly over any of these widgets or select the show details option here. Let’s talk first about the main score you see here. So aesthetic before. This core is based on an Apdex.
Apdex is an open standard. Which is used to calculate the application performance index. It is based on a targeted performance value, and it is also based on the total number of users that are connecting to the application. And based on this targeted value of performance, the Apdex defined three types of user experience levels: good, tolerable, and critical. If you want to have more information about Apdex and how it is calculated, please refer to the Kadiska online documentation, where we explain all the details about that.
So AppDex takes a targeted value of application performance into account when making the calculation. But which metric should we take into account, And what should be the targeted value of this performance metric? Well, with Kadiska, everything is automated, so it means first that Kadiska will automatically distinguish between single page applications and multiple page applications. You know that single page applications performance is mainly driven by API calls versus multiple page applications that are more traditional webpages, sites that are more mainly driven by the time it takes for the browser to refresh a page. So it means that in this case, we will take the loading performance metric into account.
And, as I said, this is fully automated. So here you see, for example, Google Mail.You see that this is seen by Kadiska as a single page application versus the website of Kadiska, which is considered to be a multiple page application if you want to see how accurate it is. So you can simply click. On this icon, and you’ll have the details here, is Apdex configuration, which is automatic. The application time discovered is an SPA, with 100% confidence that this is correct, and the targeted value has also been automatically calculated based on the historical data we have in our database. So in this case, the threshold is 85 milliseconds, which is the targeted value taken into account by the Apdex calculation.
So the AppDex score is based on the API call processing time metric for SPA and the loading metric for MPA, depending on the timeframe I’ve selected to calculate the Apdex values in my case. Last one day. Kadiska will take historical data into account to determine whether the application’s performance is improving or degrading.
So you see, for example, here in the case of the app.Kadiska.Com application, the performance is actually degrading compared to historical data. While for Asana, the application’s performance is actually improving compared to historical data. If you want to know their historical data that is taken into account to calculate it.
You can just go there to the question mark to see that in my case, for the one day calculation, Apdex calculated Apdex. In fact, Kadiska took the seven days before the selected timeframe to calculate the baseline and determine whether the application’s performance was degrading or improving.
If I take another timeframe, like the last two weeks, for example, you will see that Kadiska will take the previous two weeks into account to determine the trend. Once you have identified an application for which performance is degrading, For example, the next logical step for you may be to know the scope of the degradation.
The scope of the degradation is provided by the number of users by category in the Apdex calculation. So for example, if I take here this application Miro, I see the score: the Apdex score is 43, which is quite degraded, and the scope of the degradation is provided here. Just here you have two users that are really experiencing bad application performance, which is critical. Then you have four users that have a tolerable user experience, and only one user is experiencing any problems. If you want to know more about these users, the simplest way is to just click on this zone. So if you click here, you are automatically redirected to the application dashboard, which is filtered by the specific application and will provide you with all users’ contacts in terms of connectivity and related performances.
If you do want to troubleshoot why this application is slow, then the easiest way is to click directly on the Apdex score. Depending on the nature of the application, you will be either redirected to the API call processing analysis page or to the webpage analysis dashboard. So here I’m dealing with an SPA, so if I click here, I’m redirected to the API core scope analysis, again focused on this specific application.
Last but not least, In addition to the AppDex score, we also provide a score for the percentage of total resource transactions that failed. So if I take the example of the Google Meet application here, you see that 7.2% of all resource-related transactions failed, and you see that this percentage is decreasing.
If I do want to analyze these resources in error, I simply click. On this value, I’m automatically redirected to the resources analysis dashboard focused on the application I’m looking at and focused on the metric errors so that I have the error rate evolution over time here and I can go to the list of resources and sort on the errors to really understand and identify the different API calls that have been in errors.