


Digital experience monitoring directly improves the business efficiency and productivity of organizations embracing digital transformation, SaaS, cloud infrastructure, internet, and hybrid networks. As a result, DEM has become the fastest growing segment in IT observability, with enterprises expected to double their investment in the technology over the next three years*. Despite this rapid growth, digital experience monitoring is still a relatively new technology. Take 15 minutes to learn about DEM during this live stream event. We’ll explain the key capabilities of digital experience monitoring, and how it complements existing observability tools like APM, NPM, endpoint and real user monitoring solutions. An in-depth discussion of DEM use cases will be illustrated by live demonstrations of how it can reduce troubleshooting time from weeks to minutes for applications including:
- Salesforce
- Microsoft teams
- SAP
- ServiceNow
- Azure, GCP and AWS-hosted applications
* Gartner, DEM Market Guide 2022
Webinar Transcript
Scott Sumner: Thank you for joining us. I’m Scott Sumner, the CMO at Kadiska, here with Boris Rogier, our Chief Operating Officer, and today we want to take you through a really exciting topic for a lot of us who are into it observability. It’s what is digital experience monitoring and. It’s a new domain for a lot of people and it’s really a reinvention of how we see the user experience and all the components and the infrastructure underneath it that affect it. So we’ll be taking you through this day and giving you an overview of that as well as a live demonstration of what digital experience monitoring looks like. Inaction. One thing we’ve learned when we see Gartner and other analysts, and then our customer is talking about digital experience monitoring. It’s a whole new way of looking at things because of the way that the IT infrastructure and the cloud has changed in the way we work today. The way people access applications, the way they’re hosted. With the advent of applications, and they’re now dominance in terms of being 80% of what businesses use to get their jobs done each day. Migration to the cloud platform as a service. Work from home now becoming very popular and hybrid working. So keeping track of that user experience as they move back and forth from the office to remote sites. The reliance on things like SD WAN and direct internet access and zero trust networks all are complicating what would normally be addressed by traditional observability tools.
So digital experience monitoring is designed to address that space to proactively allow IT teams to optimize the digital experience. Resolve issues very quickly when they come up and help them manage the third party vendors that they’re really dependent on right now in terms of delivering business applications and productivity. So when you take a look at the, really, the objectives for digital experience monitoring as a space is to break down the silos between different groups within it, but also within the SaaS application vendors and the companies that are using them, as well as the connectivity and service providers that are involved in the end to end application chain and to be able to get those tickets that are staying open for months and really break them down from weeks of analysis and guesswork and troubleshooting into hours. So you can resolve things very efficiently with your resources. So the way that is defined today in terms of digital experience, observability is really a key component in an overall spectrum. Monitoring continuum for it. That starts with understanding how users are experiencing systems and all the underlying points underneath it. That’s integrated with the Unified Endpoint Management.
So taking care of devices, the digital workspace, and understanding if the machine or is any actually related to any of the problems that people are experiencing, as well as managing those devices and making sure they’re up to date and running properly. Digital employee experience, which is. The very similar to digital experience monitoring in terms of both the acronym but also the meaning. But the digital employee experience goes beyond the technology spectrum and really starts to look at, engagement rates. Are employees satisfied with their job, with the overall company experience that is fueled by the digital experience that they’re getting from using those applications, but also collaboration at much more than just that. So this is really pure productivity monitoring and making sure that employees are satisfied in their work. And that relates very carefully and very closely to human capital management. So understanding sentiment behavior, the employees, and making sure that the infrastructure around it is all supporting that initiative.
So this where digital experience monitoring fits in. And you might say where did all those tools that I’m already using fit into this? Where did they go? Because a lot of us today are using traditional tools like real user monitoring, apm, and network performance monitoring. And those are all rolled into a completely new way to see things in digital experience monitor. So by taking those traditional domains that looked at specific aspects of performance or user experience and integrating them together with analytics and a completely new way of deploying those, that’s really centric towards SaaS in the cloud as opposed to, packaged applications and traditional tiered applications. Digital experience monitoring puts new life into those kind of traditional ideas, but also changes what we would actually expect from each of those areas. So we still need to monitor how the user’s experiencing applications. We need to know if the application itself is performing well or not and what’s causing that problem. And we also need to know if the network’s performing and is contributing to the overall digital experience or whether. Degrading it, but these are more interrelated than ever before. And that’s where I wanted to have Boris explain in a bit more detail what’s happened to all these traditional domains and how they’re now integrated together.
Boris Rogier: Thank you, Scott. That’s really a good question. Basically, all of these functions will be totally disrupted by the move to cloud, the move to sales, the move to public networks. So it’s very interesting to see how the angle need to change basically when we look at those things let’s let’s start with the, with the first one. We’ve got three angles. Application performance monitoring, which focuses on how application are working, real user monitoring, which focuses on how users actually reach those applications and what is the experience they’re getting from those application across an infrastructure. And network performance measuring which is or was focusing on how network provide good performance access applications in general.
Let’s take a look at the first one. So when we think about, applications in general in a traditional mode we would look at applications that. Basically developed in house custom applications where our customers had control of all the stacks, all the tiers in those applications. And the key focus in apm traditionally was understanding what makes the application. Fast also to respond. And that was mostly focused on in application transactions. So how is my front end communicating to middleware and back ends and basically what makes front end transactions fast possible? When we look at the new world we are gonna focus. Other applications? Most of them are web or mobile applications. A lot of them are hosted in different environments. A lot of them have changed. The type of framework on which they’re based, a lot of them are microservices based. A lot of them. Use massively APIs also rely on third party services for many functions inside the applications, and also rely on other pieces of infrastructure like CBNs as an example. And they are radically different in in that. Sense that basically a agent based APMs do not fit in because it might be microservices led, because it might belong to your past platform. Because some of the functions embedded in application may be just sas services that basically retrieved the need to develop those functions inside the applications. And basically the old APM approach doesn’t apply. To that new environment.
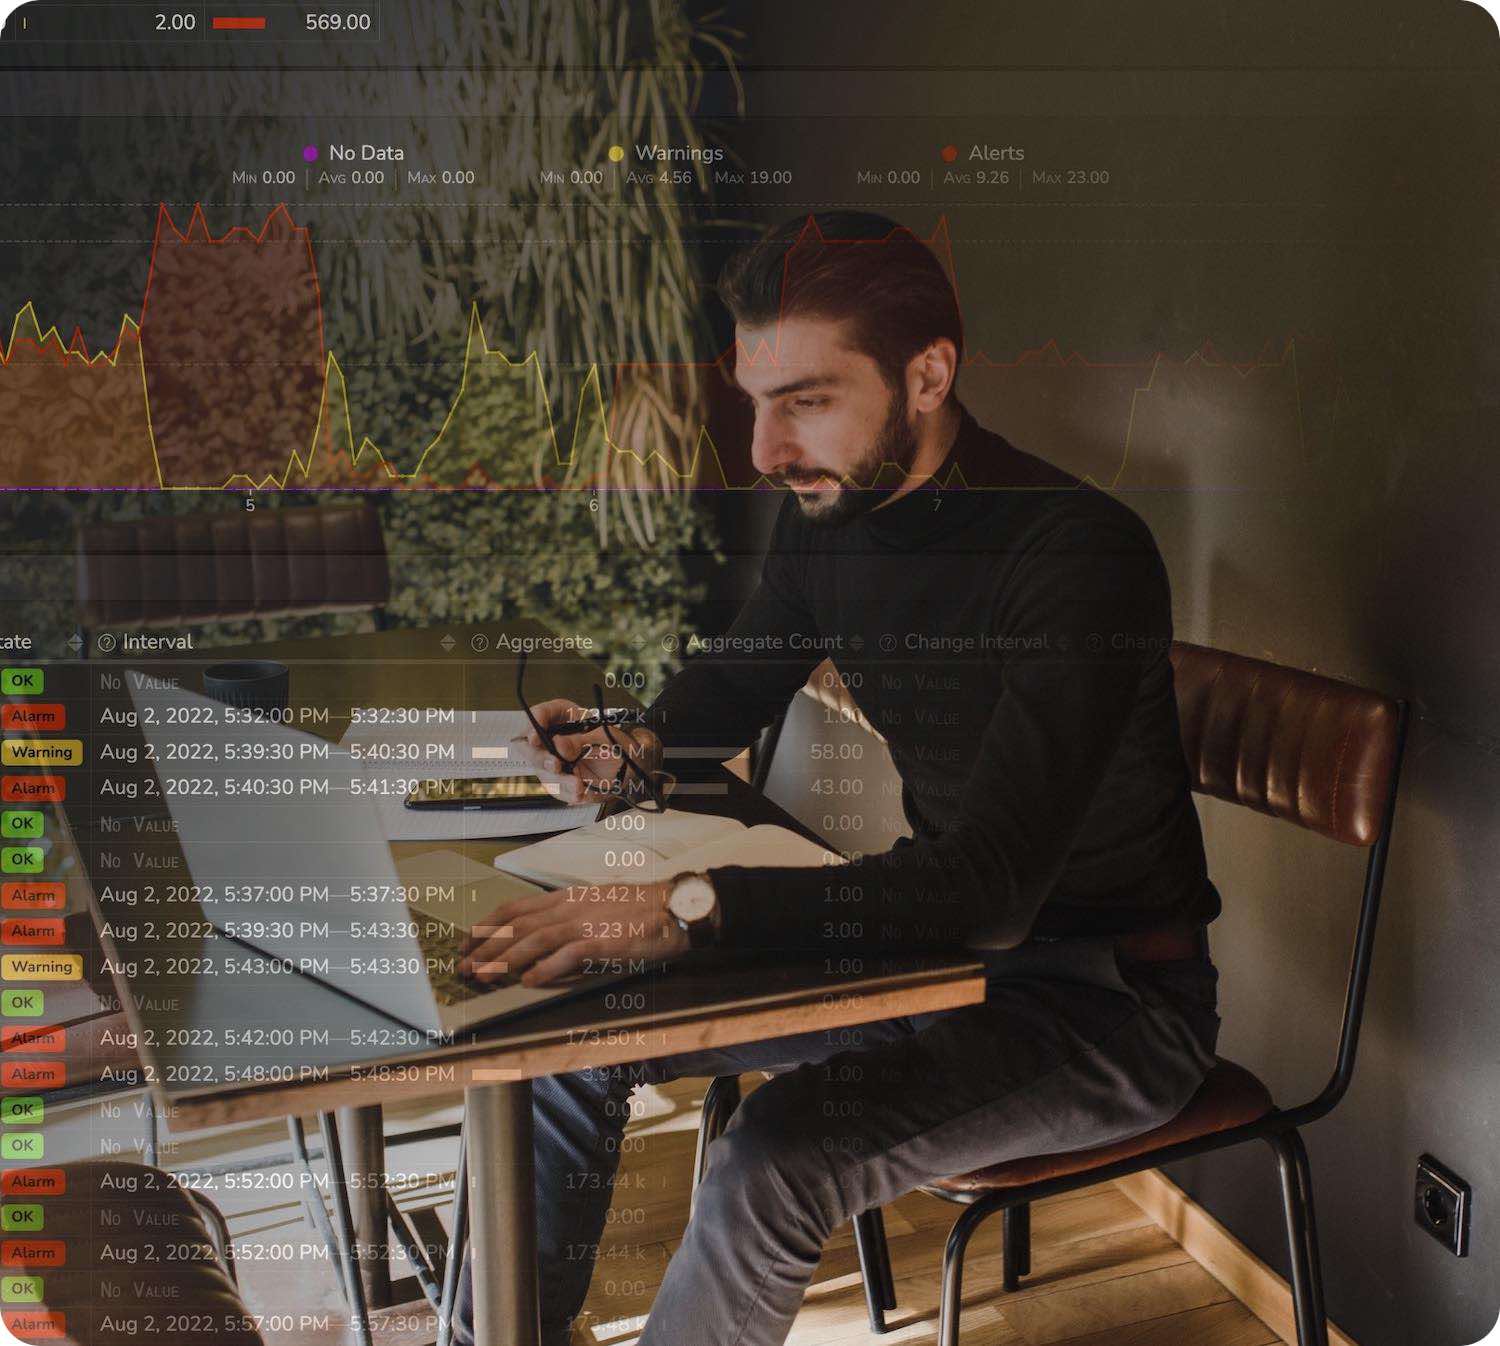
So if we want to give you an example of that I’ll take a very simple example. So we here on the Kadiska platform and we are gonna take a look at the platform itself as an example. So the first thing we would see here, Is, where are the users and who’s getting a good or a bad experience when they load on the application or when basically the process API calls to those applications? That’s one of the first changes web application do not basically use multiple pages. There are usually single page applications where you load the first frame. With the JavaScript bundle and then most of what the users are actually doing correct to API processing calls. And the question is what are those API processing calls? How do they evolve through time? What kind of results do we get depending on where users are? And how many errors do we get and what are making those API calls basically fast or slow to load? So here the first thing is, okay, the number of users what is the latency to them and what is the average time did it. To process one of those API calls and what is the error rate? And then you see a breakdown of those based on the geograph. So you see an indication of volume an indication of errors. So that’s the size of the red line. And the color will tell you basically how fast they’re loaded for example they are gonna be slower to be loaded from the US and they are. In that case.
And then when we want to start looking into those we can look at the type of devices and where they come from or through which ISPs. But most of the time what we are gonna do is look at, okay, what are those API calls that are fast or slow? So basically how does this evolve through Is there a trend that shows me that, for example, my application is getting slower on average, do I see more errors? Do I see more request? What is the distribution of response time that I get and does it vary significantly based on where people are connecting to my application from? And then the part which is probably the most interesting. Understanding where you may ha be having trouble. And basically you see all the host names. They might be third parties. Like here you’ve got things provided by HubSpot. You might have things provided by. Our own systems mixed together. And basically what is the intensity of the use of each and what is the restaurant sign for each of them and how they vary depending on the system. All the browser used by people to connect to it. And then you see the actual API calls or transactions. Those API calls are gonna be the things that are extremely important for us to measure. And if we want to see, for example, what is slow, we can simp. Filter and look at the ones that are longer processed than 360 milliseconds. And we will get a clear view of, what are those what are the most common ones, which are the ones that would require some some optimization, and what is the infrastructure layer? Is it the application? Is it a network issue? Is it a browser issue? That basically makes it slow to perform? And then we could basically look into the errors themselves and get into. The full details and see if it varies depending on the platform used by users et cetera.
Okay, so that would be your first demo of what APM is today when in, in that new world, which is radically different from what it was. Okay. If we move to the second topic, so real user monitoring was really designed. To show the purposes from an end user experience to those applications. And traditionally it was applied to in-house applications with a focus on one application. The deployment was made from the application side. For example, for web application, it would consist of placing a JavaScript insertion reference in the code. And that would give you an idea of where people come from and what impact it has on the experience. When we think of that new world, a lot of those applications have been replaced by SaaS applications in most cases in all the cases that are gonna be replaced by. PaaS applications that allow to build application much faster, and sometime a combination of them to build what we call a composable application which basically is gonna provide one front end, which can be a pass platform. But that front end is gonna go and. Basically pull data through APIs from multiple sources, which can be surpass or legacy applications. In most cases, basically the application site instrumentation is simply impossible. So you’ve got to look for all the ways and basically RUM has to be reinvented to be deployed from an endpoint from a user side. Point of view and also to represent, the impact of all the host names involved into composable applications. Basically, a third party host names not only the core host names of sales service, but also everything that can be integrated into it using CDNs and APIs.
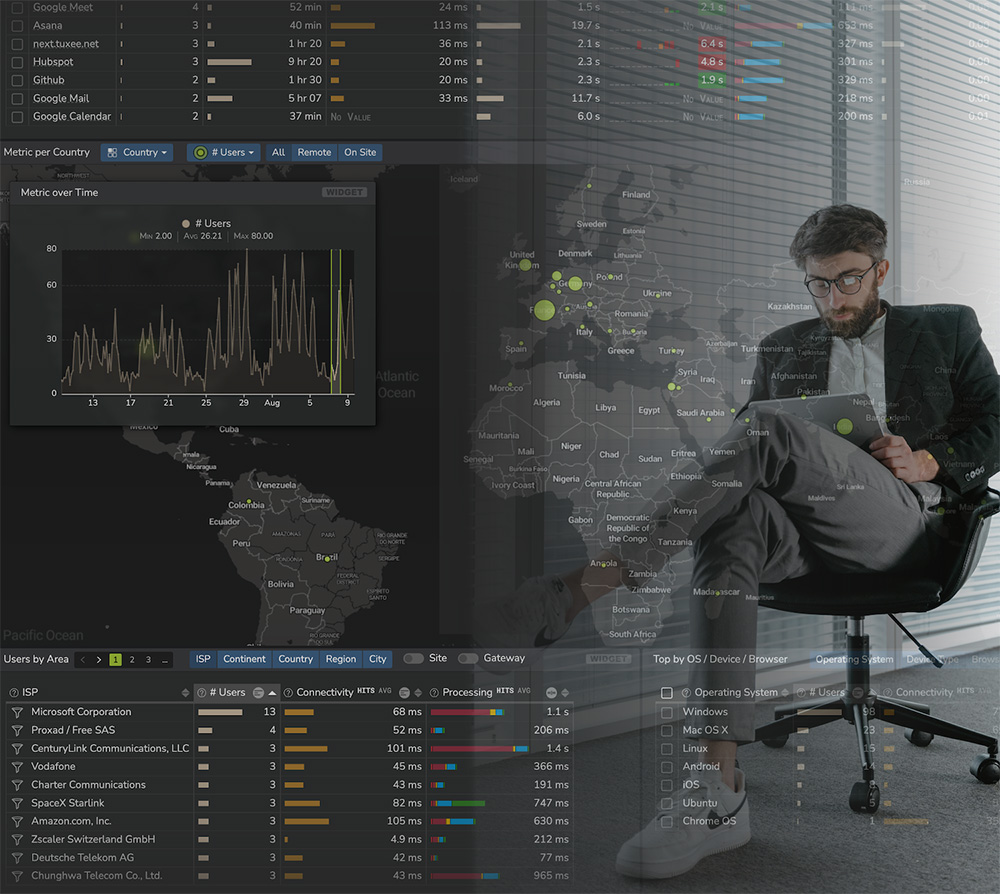
I would take another example which would be RCRM for example, if we take HubSpot here where you see a certain number of users, you see that creativity is actually not great from most of our users. And then you see how fast we load the page of HubSpot, which is not the thing we do most frequently, but how. How long an API call would take to be processed? If we want to understand what is performance to HubSpot and what drives it? We would simply make a single click to. Applications, and then we would see basically our users getting to that application. How the page loads the time needed to load pages basically evolved the time to do API processing. And the percentage of error vary full time. So you can see that there was definitely a slow response from the application overall. And then we’ll find out. Who was impacted and why. And then you can see basically how those tho that experience varies depending on how people are connected. So whether they are remote or whether they are sitting on one of the of our sites. Of course you’ll see that some people working remote had trouble a lot. Connectivity hiccups probably far longer response times than the people working on site. And you can see two examples of that. That could be the people connected through alcom or connected through Vodafone Espania.
And you could see that from a geography standpoint and see where those people are. So the people working from Spain for example, mobile work congress this week definitely didn’t have a great access to hubs. And in that case, we would simply take a look at this and get a confirmation of that so the people having trouble accessing HubSpot or remote people. And then we could look at individual users or focus on the given point in time. And that would give us a feel for, okay. We had people with poor connectivity on the 28th. Who are those people? Not the people based in Canada but the people connecting from sfr. Probably they’re in France and they’re having trouble. So let’s focus on the remote people, for example, in France. And we are gonna be able to say that it’s one of our colleagues called David who had trouble. And from there we could focus on David and make a focus on him. Maybe take a wider look than just HubSpot and see how his work working has been to all the applications and see if the problem he had with HubSpot from a connectivity standpoint also impacted other applications. Seemed to have impacted another application called Wal Xi and he had trouble connecting to notion, but that was definitely a server problem. And then basically we can. All of that evolution. So page loads, processing time, so we can see when working for him was what was a challenge for those reasons. We can see how his connectivity evolved and for example, we can see that on the 27th. His connectivity was pretty bad and we can tell exactly where he was and basically what provider he was using that was creating such trouble. So DNS was very bad on sfr at that time, and that was close to Tolu. And we can also see CPU and RAM usage so that we get a 360 degrees view of why applications might be experienced in the pool way from a user perspective.
Scott Sumner: Great, Boris. So let’s take a look at those examples. Actually, you had some network performance issues that were causing problems for david. Maybe you can take us through what a, a new kind of network performance monitoring would look like to help you there.
Boris Rogier: Yeah let’s let, basically what, what changed in network, any network monitoring as a consequence? We come from a world where most of the networks were private networks and PLS networks, and basically we had onsite people connecting to data centers. So the focus from a monitoring standpoint was on devices that were under how customers control or directly the ones of the service provider providing the link and we were focusing on the link from bans point of view and from a preference standpoint. So monitoring devices, monitoring bandwidth was the way to get visibility into what was going through the network capacity was key. And basically the roots were clear. We went from point A to point B. There was no nothing to think about from that point of view. The root was clear. The responsibility of the performance between A and B was also crystal clear. If there was some kind of issue, it was easy to know who you would you would have to reach out to to fix the problem. We basically moved to completely different world whether you consider, site to site or site to app. Connectivity using SD one and hybrid networks, or whether you consider, remote worker connectivity using SASE Solutions, Zero Trust Networks, CASBs, VPNs. There’s one thing which changes radically which is the use of public networks. So basically all of that although we built overlays, build it. Although we claim to have points of prisons all over the world rely on public connectivity, rely on DNS. Redirect people to the right place. And what changes fundamentally is that using public connectivity you don’t use the network of one organization, one service provider. You use a series of of networks. And the pass can change any time. The DNS resolution to a certain cloud service can change also any time and it’s all dynamic. That’s the first thing. And the second thing is it’s all based on devices you can’t monitor. So none of those devices are actually yours. And still the drive, all the network performance for your users to reach application.
So the focus has changed from a device and traffic focused. To something which is more a pass focus to understand exactly where problems are coming from and how you can work around it. Is it the key things are gonna be, is it my cloud provider, which is not redirecting me to the right place? Is it a change in the past? Is it something I can. Workaround basically using another route, another end delay. And is it something that happens on my SP side, on the CDN side of the provider or somewhere else on the internet? And basically the thing you need to answer those questions are totally different. Let’s take a look in. And fine. So the first thing you saw was basically a view of how remote and people access applications. So that’s the first thing, is understanding where connectivity isn’t good, from which from which. I s p to which application? So for example is my zero trust network from one of my subs providing longer latency than another. That would be an excellent question to ask in, in those worlds. And basically, how do we connect users on the left? Through gateways and cloud services and Zero Trust Network, two applications. That’s gonna be the key. If someone has trouble connecting from hub stop, who are they? Where are they connecting from? And what about the people using that gateway? Are they getting a better or worse preference than people coming from Palo Alto, for example, using Z Scanner? So that’s gonna be the key question that tells you Basical.
What can go right or what is actually going wrong? But then you need to find out why. And the why usually lies into what is the path that you are taking. So if I take a simple example of an application, which is widely used, if I take Salesforce as an example I’m gonna show you a live map, for example of the last, say, 24 hours and show you where Salesforce is properly accessible from. The CDN and the past from Salesforce. So I can see that, for example, from Malaysia. It turns into purple latency, super long, so it’s gonna be very hard for those guys to reach Salesforce. The red indicator tell me where there is backup loss. So for example, from Japan or from China. That’s gonna be some form of challenge. The other thing that I can read here is that the past platform seems to be pretty accessible on average. The behavior from latency and large point of view seems pretty stable. The access to the CDN of Salesforce looks a lot more ec tech. So let’s focus on this. So I just refresh the map. I see that, for example, some people in the east side of the US have trouble. Some people in Liberia have trouble. And the question is gonna be why and where from. So I can take a look at, all the offices that I’m monitoring. And I can see basically the change in behavior. And I can see, for example, that in India I had a big degradation of latency from Singapore. I’ve got a huge outage. So if we focus on those two places which I could have seen, with the first screen I showed the question is why and what can I do about it? And basically to understand what I can do about it I’m just gonna have to understand what is the path that I’m taking and why am I getting to those horrendous latency rates, which means people basically confuse those things or are gonna have an extremely slow response. And there is huge a lot of packet loss.
So what I see here, All my remote sites. And then I see basically each.is gonna be a router. Each color correspond to an operator, an autonomous system and each point on the right correspond to a different DNS resolution for the same Salesforce service. And the question is gonna be what is happening when I have those tremendous latency and loss, and where is it coming from? And basically what I can do is just do this and see, okay the latency is actually being dramatically impacted at the exchange, the internet exchange in Singapore to reach this. This CM node of Salesforce. So what I can do is try to I mean I can raise a ticket towards Salesforce because it’s their responsibility. I can clear the cash of my browser, try to do to have user refreshing, getting another DNS resolution, hoping they’re gonna be connected to another node and not go through that. And in the case, of Nashik in India, so it’s gonna be the red. I’m gonna flag another time where there is a lot of packet laws. This time I’m gonna find out where basically I can see it’s right before the CDN node here on the Telstra network. So again, it is definitely Salesforce responsibility. If this had been identified, for example, in the last mile, say, on the reliance, I was the ISP for that site and I’m using an an SD one, I could have basically worked around it by using the secondhand delay and use another operator to get to another route, basically, another destination to reach the Salesforce service. Okay, so that, that’s what NPM would look like today. We don’t care so much about bandwidth. Basically all this encrypted. So what we can get from the traffic is limited. So the focus is really on response times and having the proper response time from network standpoint to reach the services that matter.
Scott Sumner: Thanks, Boris. That’s awesome. It’s important to see what’s available now so you can really solve those problems quickly. I think it’s about what you’re pointing out is. , you’re going to be dealing a lot of the time with third party vendors, whether it’s Salesforce or your I S P or people that are managing your sdwan, for example, even internal groups if you’re developing your own web-based applications. So it’s really about having the evidence you need at a moment in time to have a really good, productive conversation with those vendors to help. Identify quickly how to solve that problem with their own trouble tickets. And it’s very hard to raise a ticket to Salesforce and say, I’m having a bad day. They’re not gonna do very much about that . So providing much more detail about it being part of their CDN group like Boris has shown, or it’s a server related issue can really change an awful lot. And we see that in real world application troubleshooting all the time. . So I wanna just take you through a quick view of the benefits. Here. You see the overall picture of what digital experience monitoring today is, looks like. The key aspect of this is the integration, the ability that Boris showed you of going from a user’s experience, application, performance issues, identifying whether the server. The network, the device, the browser applications plugged in. Applications, where is the actual problem coming from? And then being able to go down to those transactions and get the evidence you need to resolve them. That’s really fundamental. And so is the path visualization. It tells you more than just, is the link up or down? And what’s the speed test? Tell me it’s actually, where did the traffic actually go and where along that route did things go wrong?
So there’s benefits to digital experience monitoring. Are quite wide ranging. That’s why it’s such a fast growing space. What we’re seeing is today about 20% of organizations are using digital experience monitoring, but within three years we, we will see that rise to about 70%. And that’s an interesting testament to the power of this kind of solution. So IT teams can really accelerate their problems far faster. They can focus their resources so they’re not just chasing ghosts and making hypothesis and testing. They’re not just trying to prove that the network is actually responsible or not. So the proof of innocence gets off the table and it really helps people work towards a common goal and keep the complexity down. So you, we have a lot of tools today already. Using two or three tools to solve a problem won’t work anymore if they don’t have full visibility of what’s happening across this infrastructure. But for the business, it’s actually the reason why there’s budget being carved out for this now is more because productivity is critical in a digital world. We are very dependent on a digitally transformed cloud enabled environment. You want your employees to be productive or actually they’ll just resign. We see that about a third of them people leaving companies are because they feel they can’t be productive with ancient systems that are not behaving. So when you’re loading Salesforce and it takes over a minute to get the page up and running, that’s the kind of thing that can drive people nuts and lose their engagement.
So bringing the enhanced digital workspace to everyone in the organization, wherever they are, and then driving customer satisfaction through very effectie. Responsive systems that let you serve your customers better is really the goal for digital experience monitoring in general. . So I wanted to just wrap up here with an invitation to the attendees today. If you’re interested in trying out that platform, you can certainly get a free trial from us and we can take you through an assessment of what digital experience monitoring can do for your specific business applications and how you’d be able to monitor those and identify bottlenecks within minutes of getting the platform set up. So very simple five minute exercise. Getting onboarded, and then we can take you through that and you can explore your world with a lot different lens, basically seeing it in the higher resolution than you would normally see with traditional tools. So I’d like to thank Boris for the excellent demos there and For the insights on the traditional tools and how things are changing. So Boris, thanks for your time and thank you everyone for joining us. You’re welcome. and the recording will be available. And if you guys are looking for any more resources on digital experience monitoring, please visit the website. We have a large collection of resources related to what it is, but also in specific use cases and how it can help you troubleshoot your employee’s experie. Thank you everyone. Have a great day.