Net-Tracer
Kadiska's Net-Tracer network performance monitoring provides end-to-end network visualization to detect and diagnose network issues impacting digital experience

Network Performance Monitoring
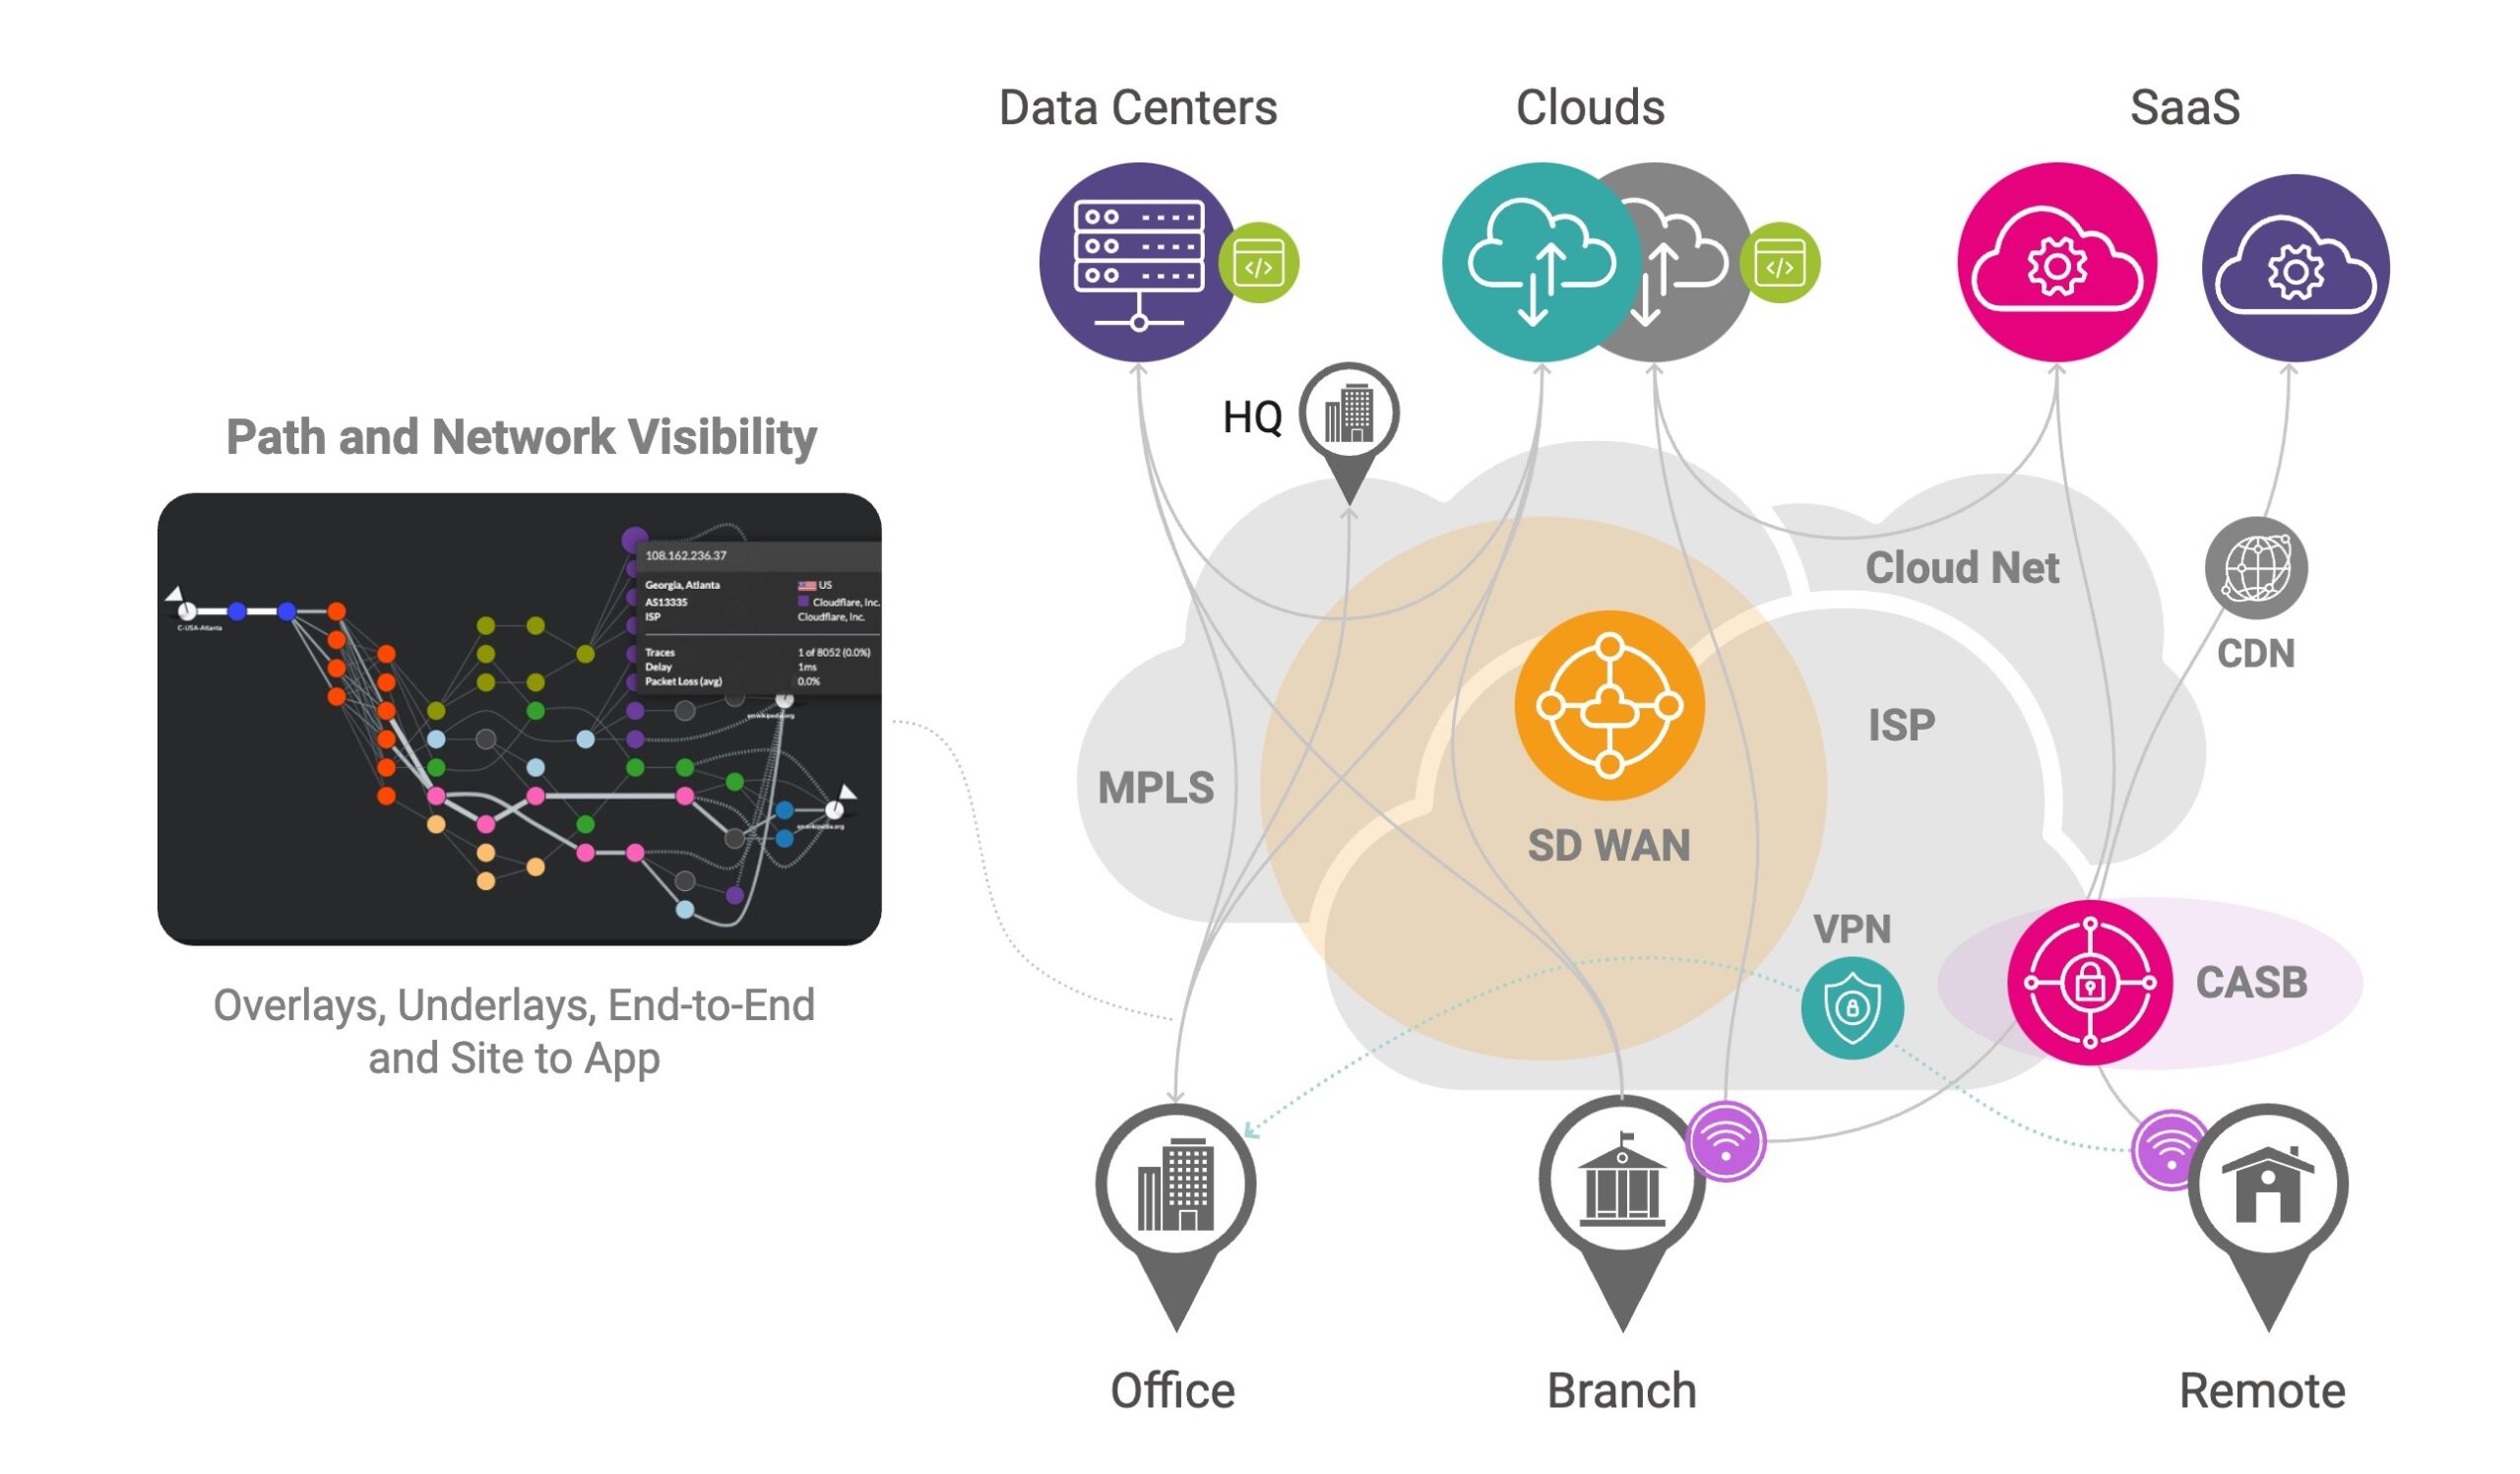
Network performance monitoring (NPM) techniques have been redefined by cloud and SaaS applications, the internet, SD WAN, hybrid network connectivity, and work-from-anywhere employees. Dynamic, complex networks dependent on public and cloud network routing require more than a simple network monitor to understand network performance, degradations, and their origins.
Closing the Network Visibility Gap
Traditional network performance monitoring techniques relied on traffic capture and flow analysis. SaaS applications, PaaS and cloud hosting and encrypted traffic between servers and browsers, combined with interconnected applications, diverse hosts, distributed and mobile users limit their visibility. Kadiska’s synthetic monitoring overcomes this visibility gap by automatically adapting to dynamic network routes, and allowing full path segmentation between users and applications.
Full Path Visibility
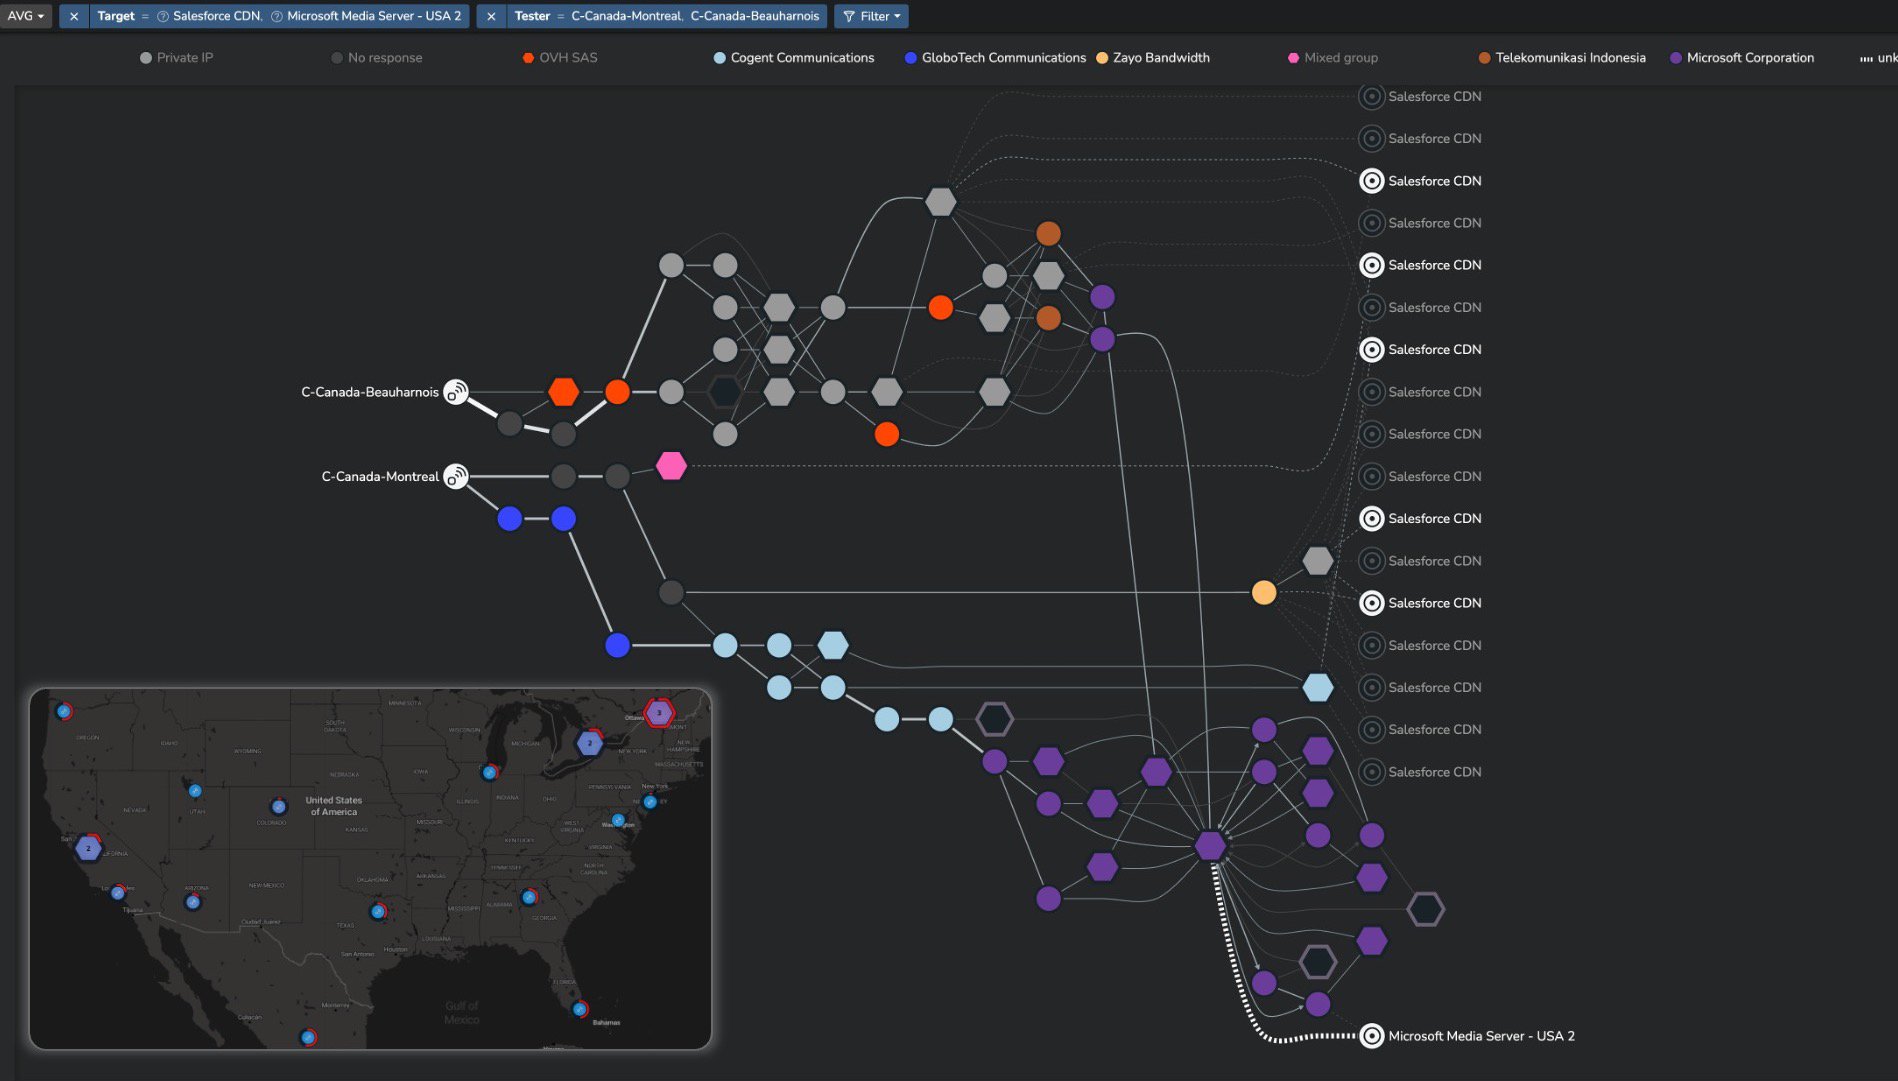
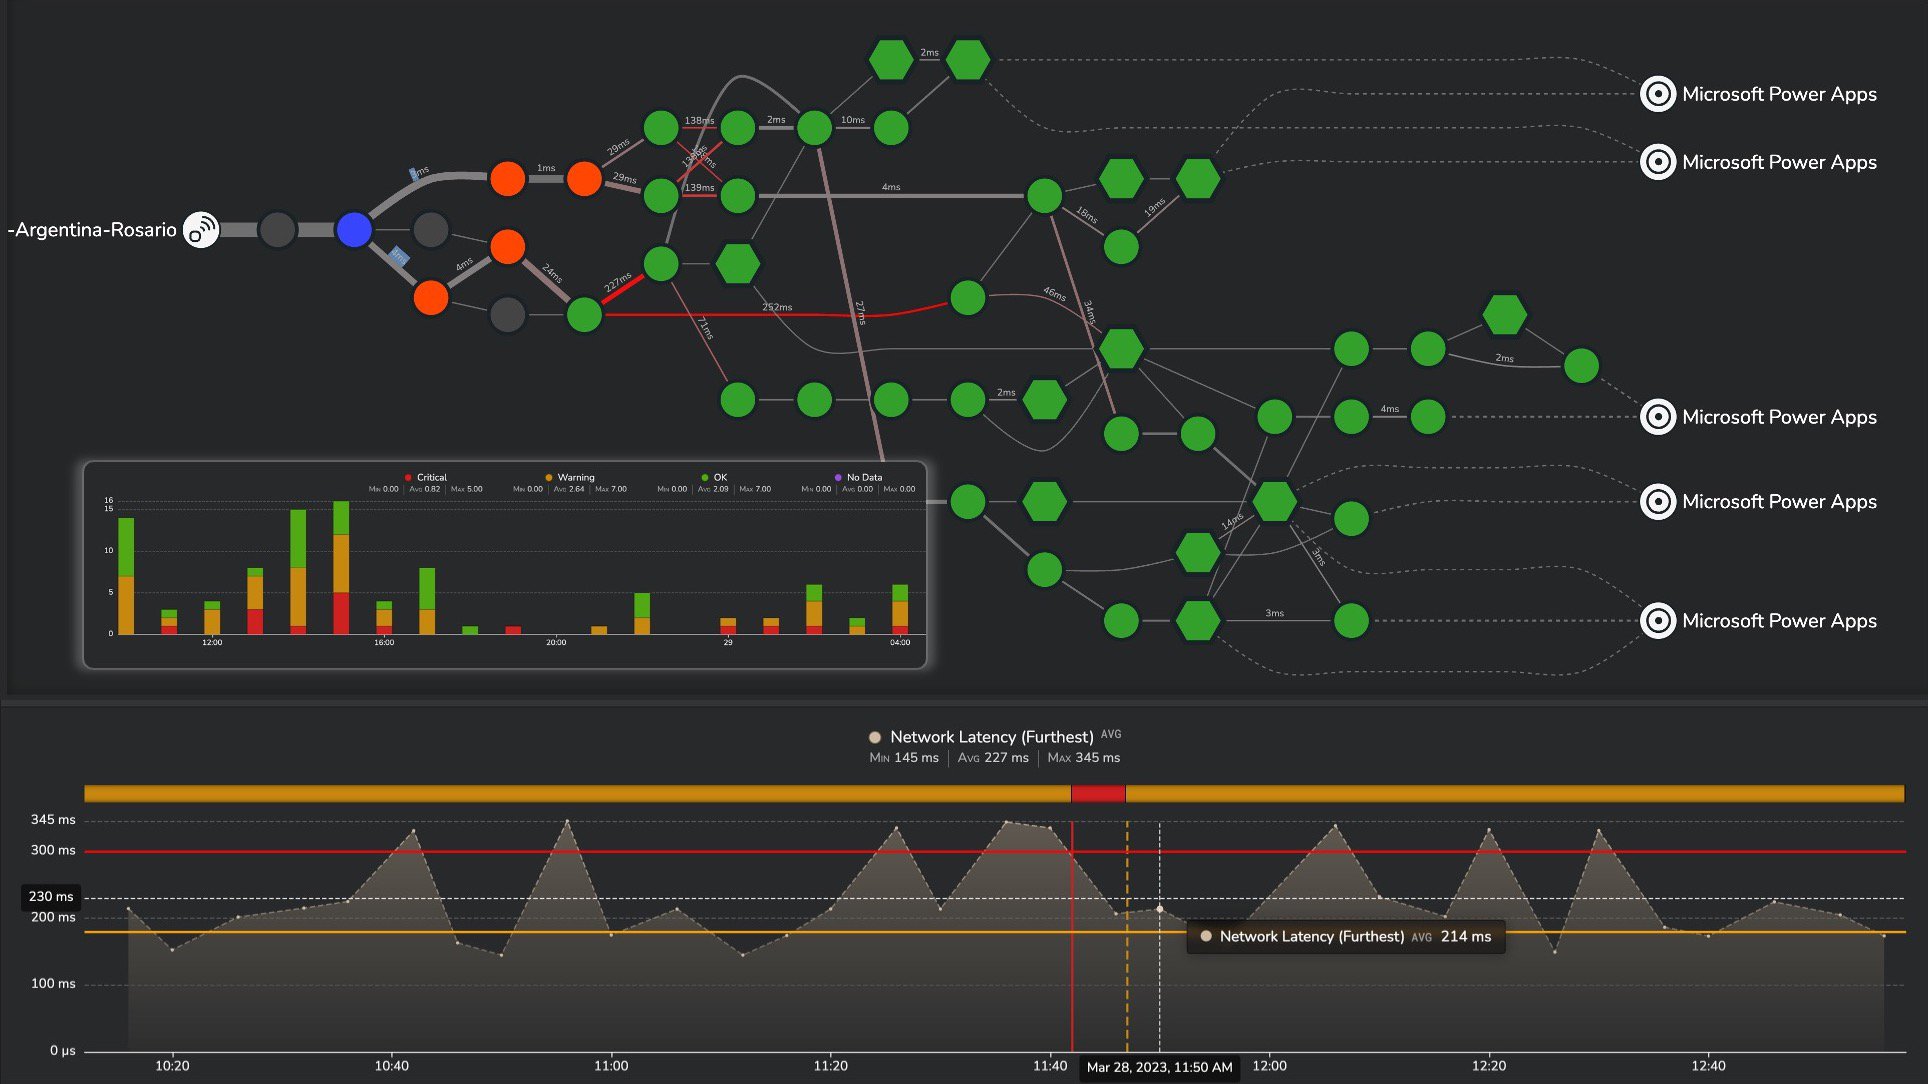
Kadiska’s Net-Tracer continuously monitors key network performance metrics–latency, packet loss and path length–for all network segments, as well as end-to-end performance. It identifies all service providers and networks along the route, how they change over time, and how the network impacts application performance and digital experience.
Use Net-Tracer to Monitor
- User-to-App network performance
- User-to-Cloud network performance
- SaaS-to-Cloud network performance
- Cloud-to-Cloud connectivity
- Site to Data Center network performance
- SD WAN, VPN and CASB performance
- Private/MPLS, CDN and VPN performance
Network Performance Analytics
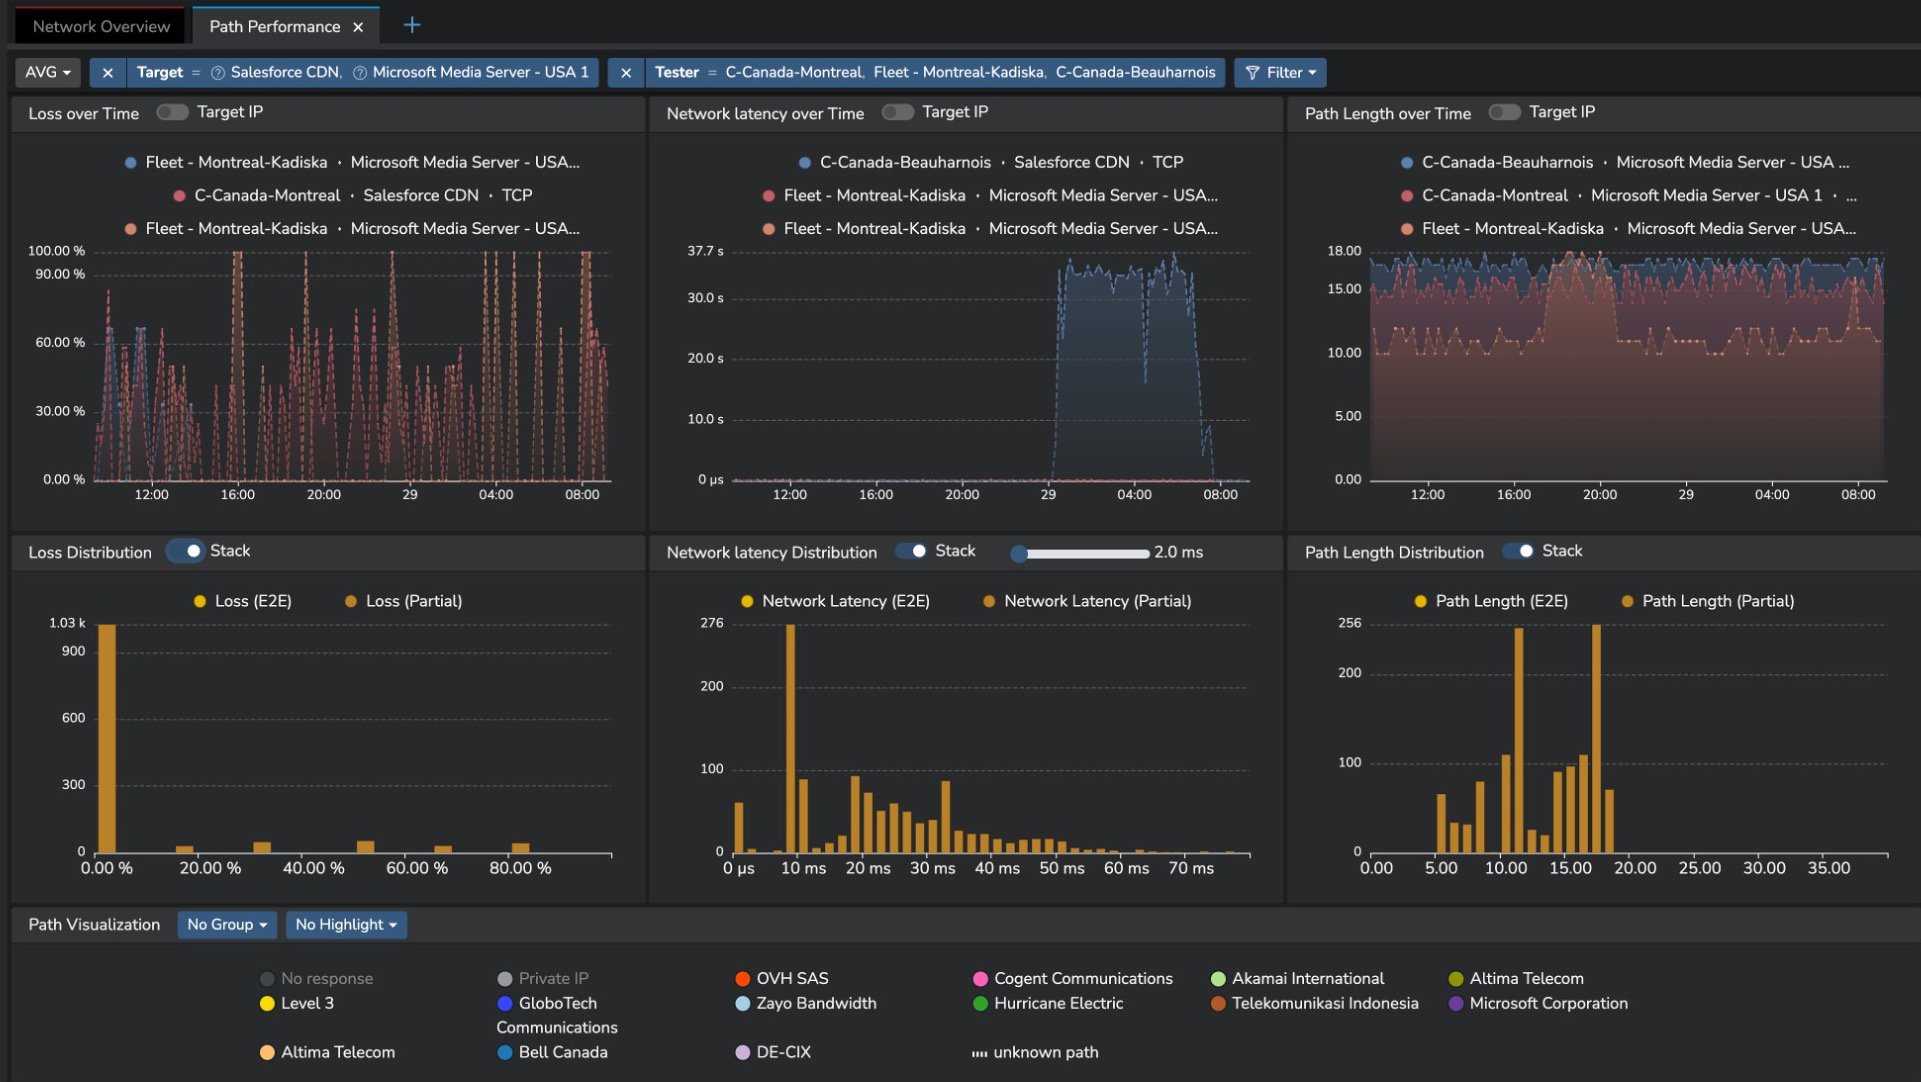
The Kadiska digital experience platform provides in depth network performance analytics from anytime within the last hour to the last several months. It provides distribution and detailed insight into loss, round trip time and path length over time, And allows you to select any network event to understand its underlying origin.
Network Performance Fault Isolation
Net-Tracer’s automated alerts immediately guide network operations teams to the origin of network issues in context of users, locations and destinations, identifying BGP routing and redirection issues, cloud network connectivity problems, ISP and SD WAN performance degradation. Network visualization shows precisely where latency, loss and route changes are introduced and provides the evidence required to resolve issues and hold service providers accountable.
From Wi-Fi to SaaS and the Cloud
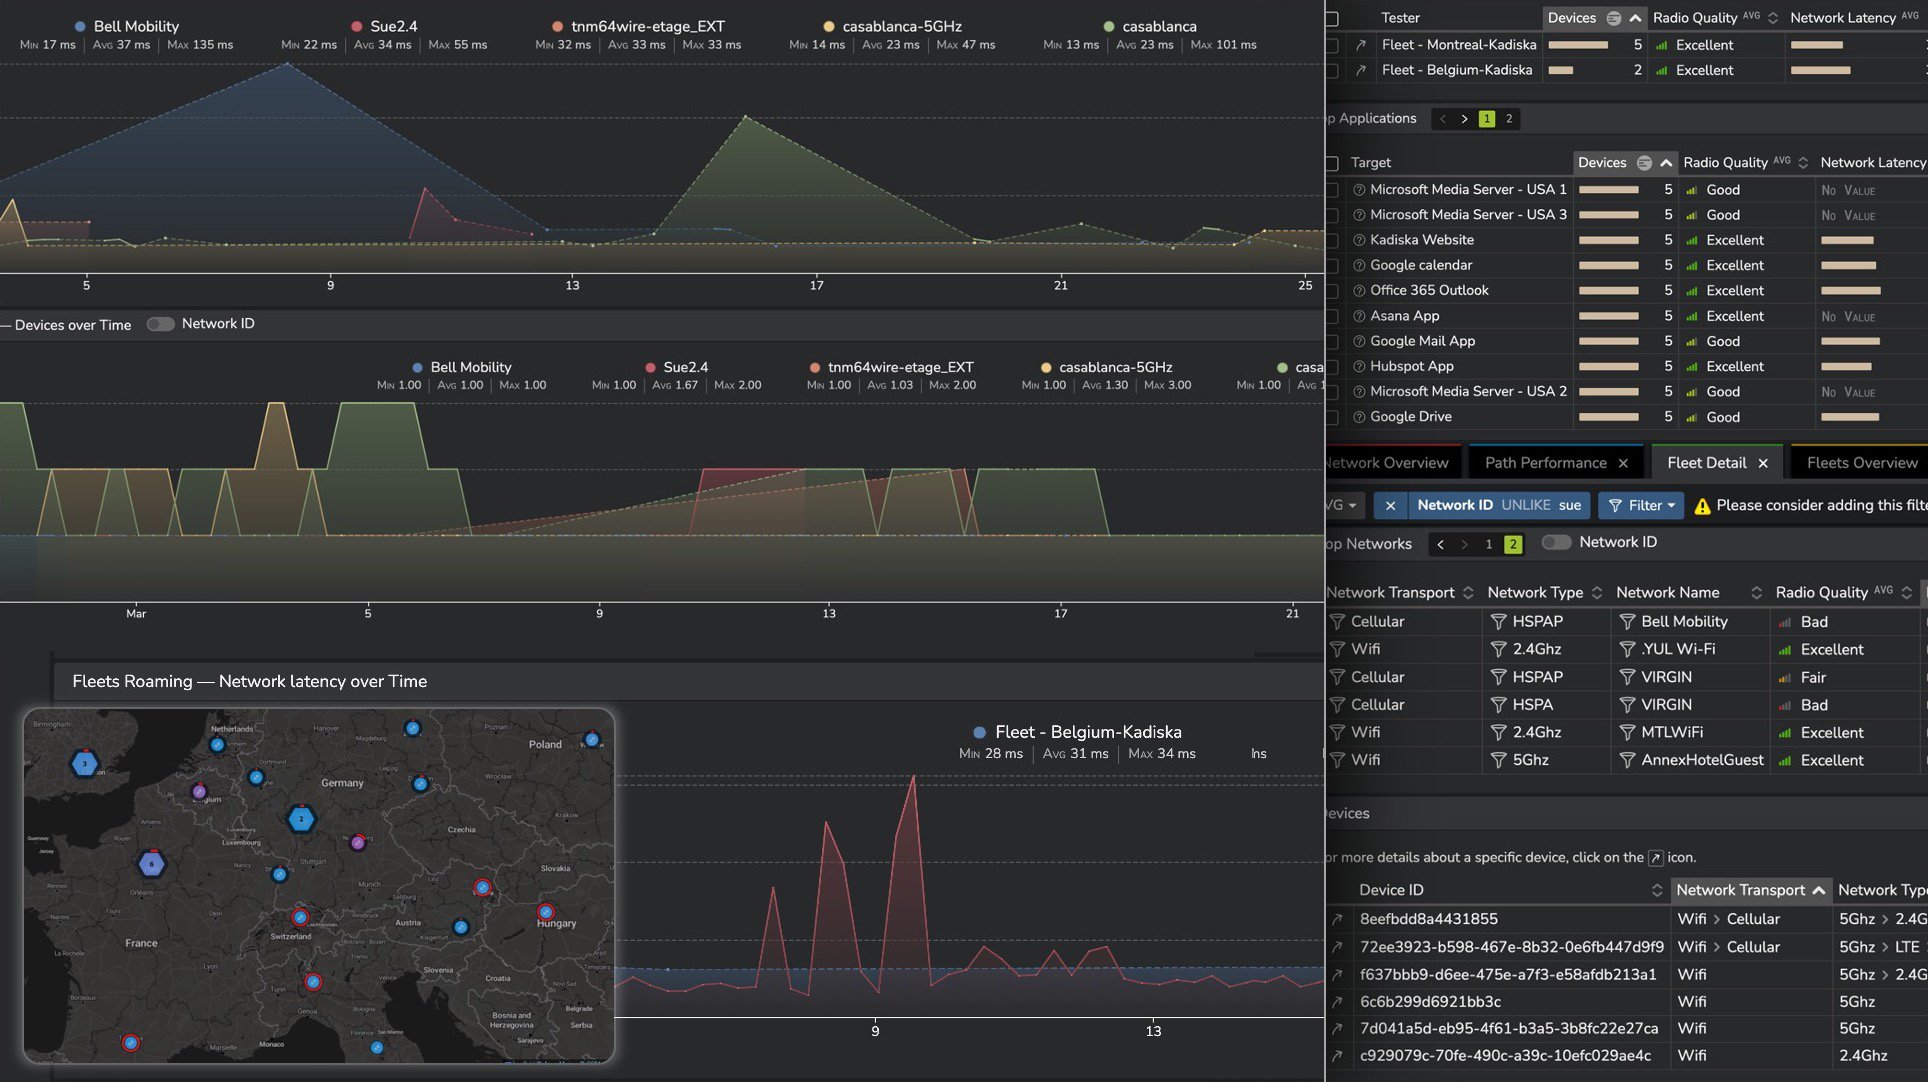
Is the Wi-Fi really the problem? Net-Tracer automatically identifies Wi-Fi performance in context of the overall network path from device to app, eliminating needless Wi-Fi troubleshooting when it’s not at fault, and locating precisely where latency, loss and application response issues are introduced. It also knows which devices are connected to Wi-Fi hotspots or Ethernet connections, and whether mobile devices have switched from Wi-Fi to cellular data (LTE/5G).
Flexible Deployment
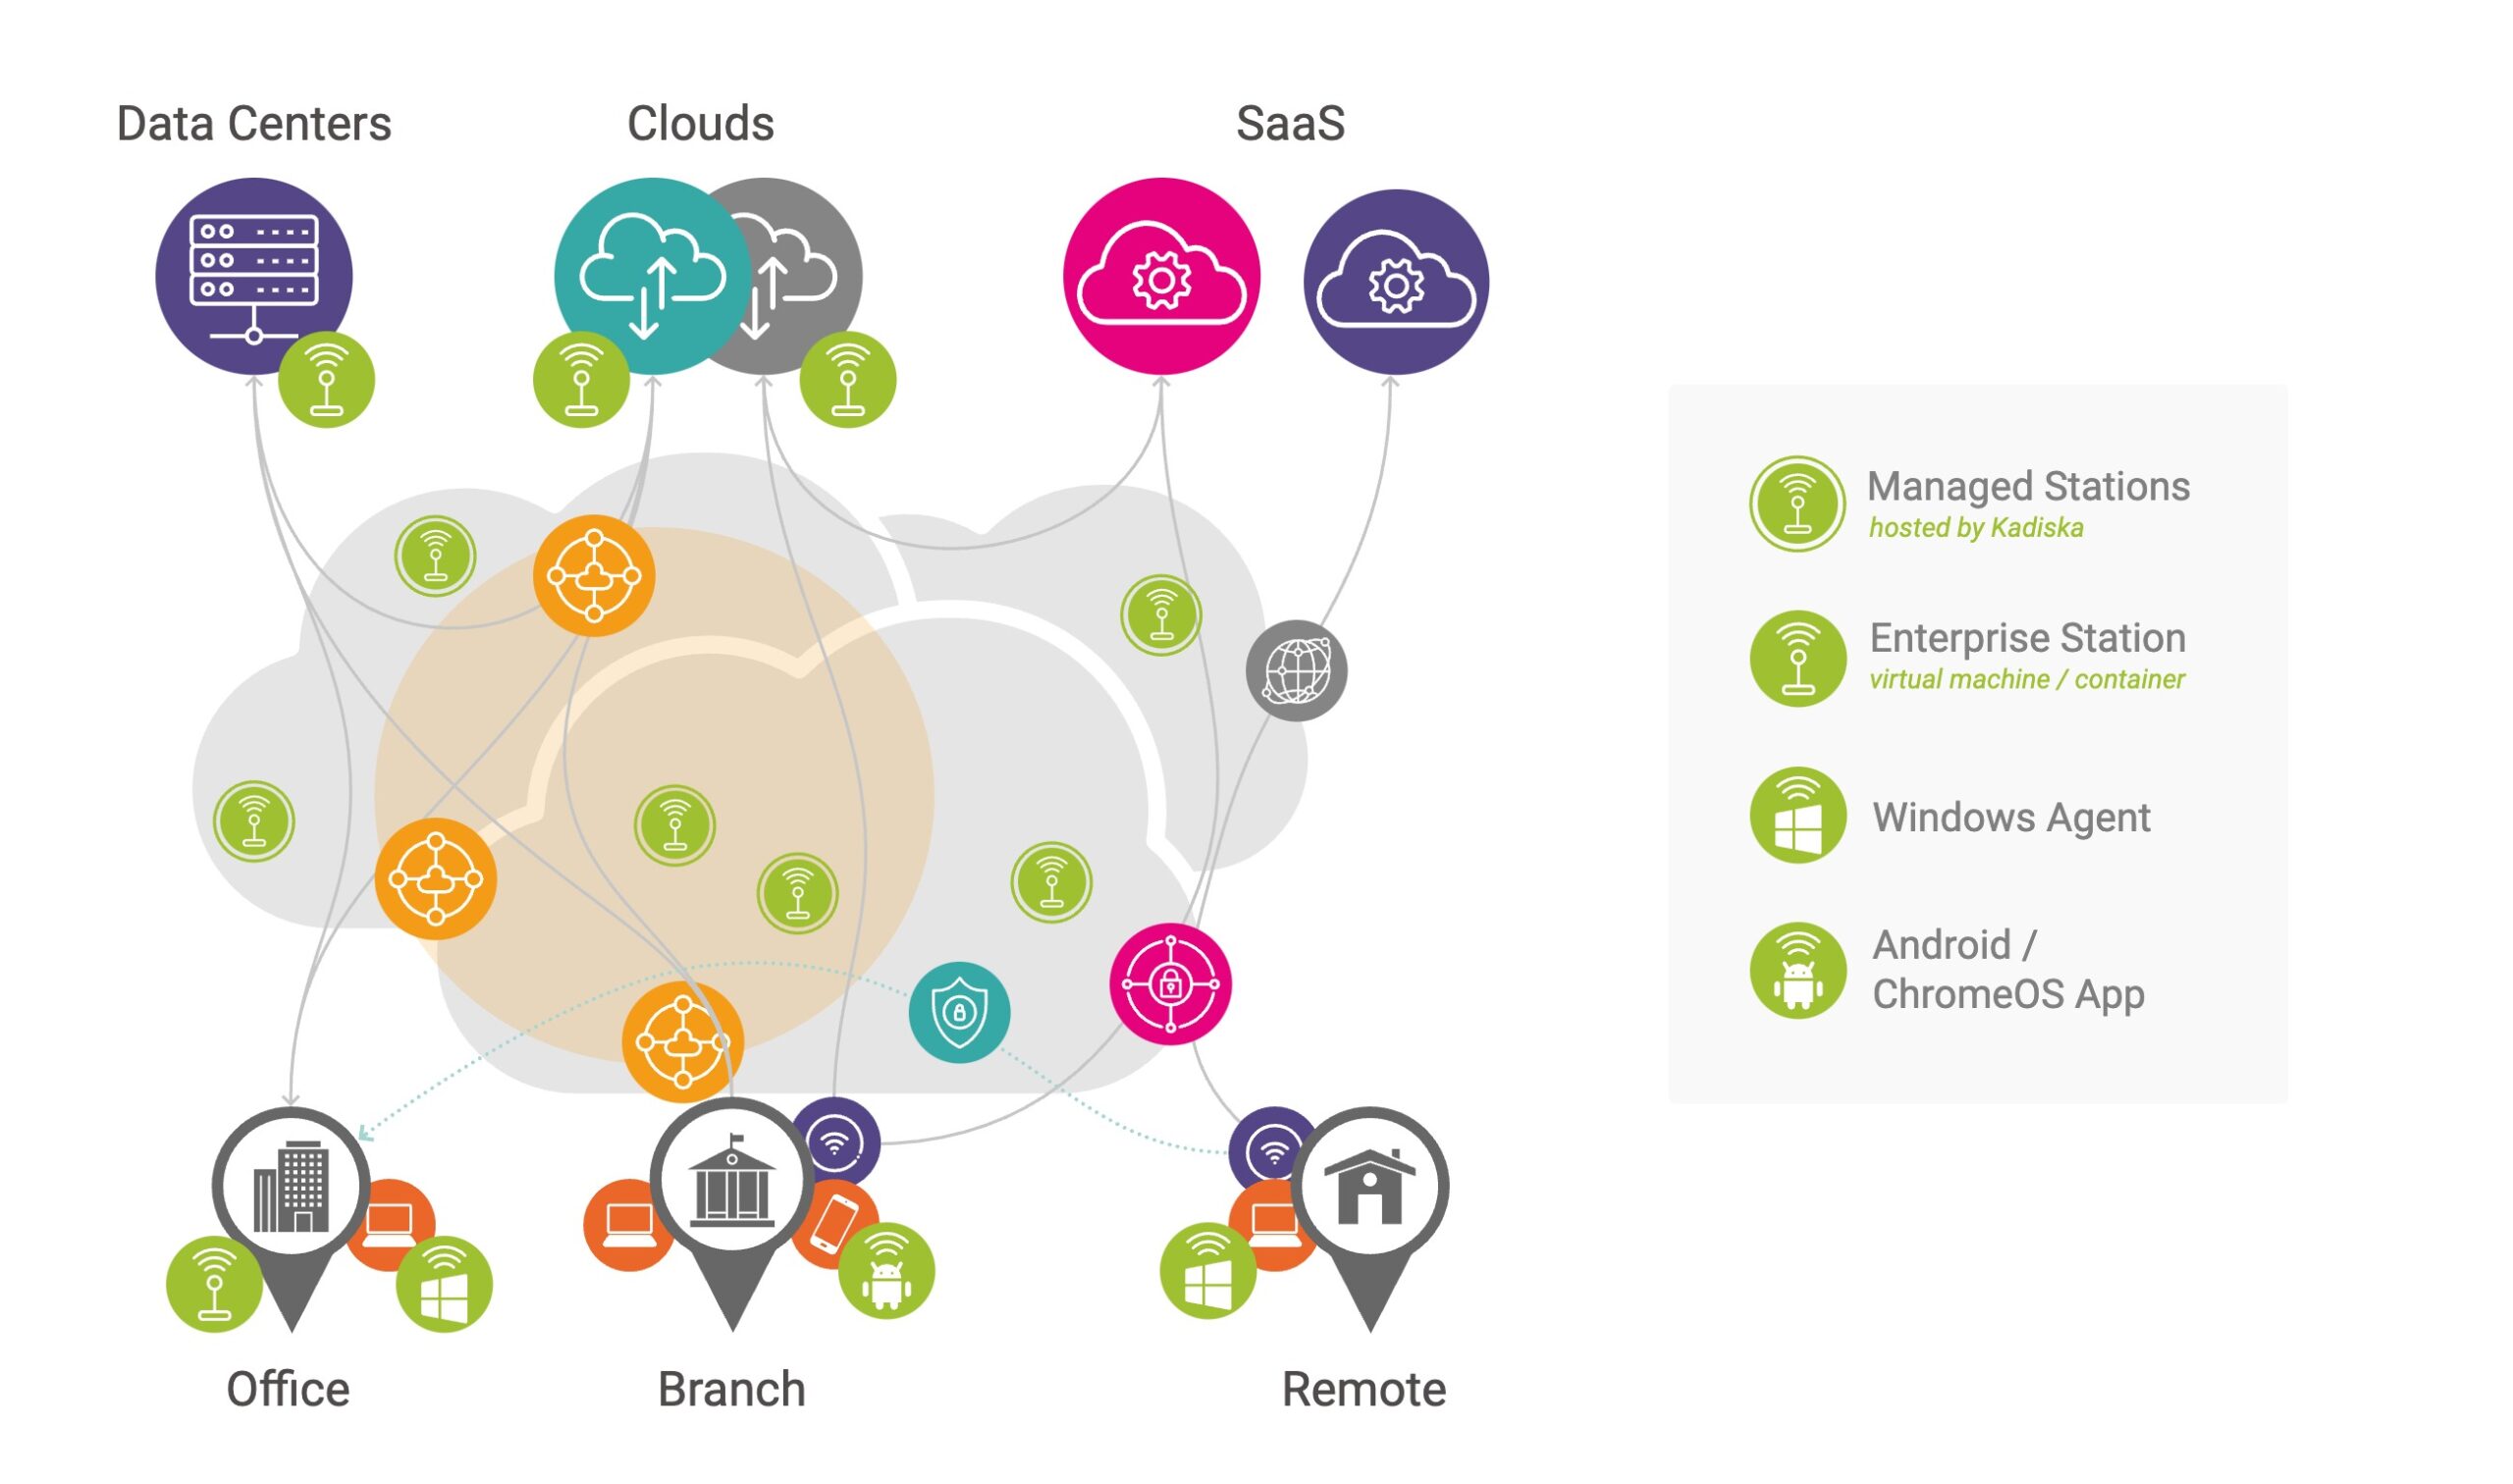
Net-Tracer testers are easily deployed on virtual machines, containers, Windows, Chromebooks and Android devices including phones, tablets and smart TVs, enabling a wide-range of network monitoring use cases across retail, manufacturing, banking, healthcare, logistics industries, enterprises and service providers.
Deploy Net-Tracer Network Testers on:
- Docker Containers and VMs
- Windows PCs and Servers
- ChromeOS / Chrombooks
- Android devices
Managed Stations
Kadiska also offers hundreds of managed test stations across the globe that allow any user to monitor connectivity from key countries, regions, cities and service providers to understand how customers and employees access and experience websites, SaaS, and cloud applications.
