As explained in our article ‘What is a Single Page Application (SPA)”, a SPA is a web application built around a single HTML page.
User interactions may trigger partial modification of the page content and structure, but do not trigger full web page refresh. The application logic primarily runs at the client side, by executing JavaScripts and performing API calls.
So, monitoring SPA user performance means that traditional performance metrics like Page Load Time (PLT) and newly Core Web Vitals are quite inadequate as they are only computed when a full page refresh occurs. So they miss nearly all user interactions that follow the initial page load! In a nutshell, monitoring user experience for SPAs (Single Page Applications) requires a different approach than traditional web performance!
In order to understand how to best monitor SPA performance, let’s first review the way an SPA works.
The SPA main principles
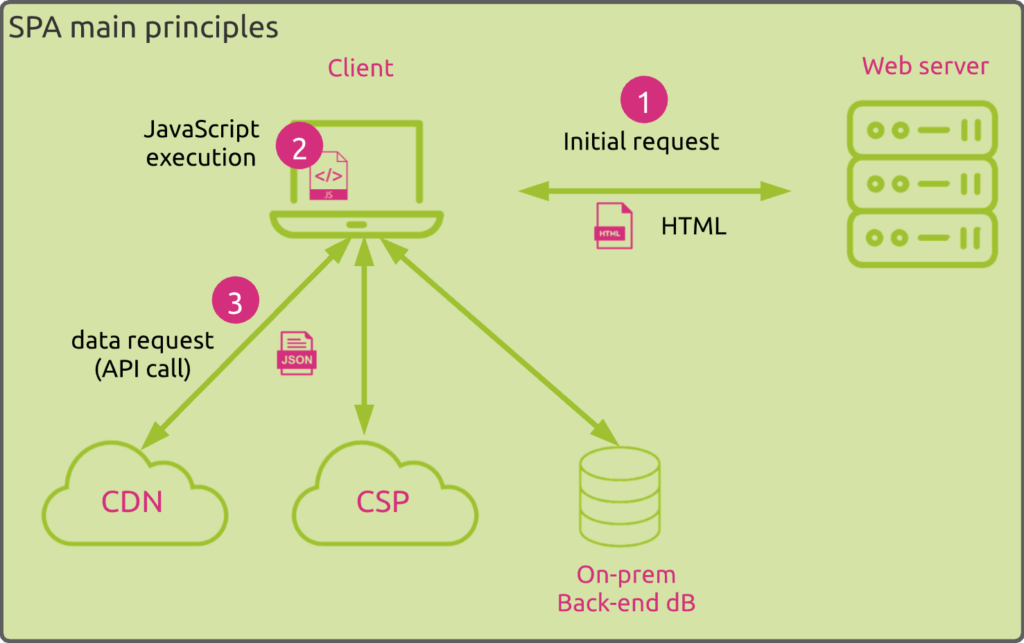
If we try to schematize how a SPA works, we can summarize the whole process in three main steps/events.
First, the user connects to the web application by typing the corresponding URL in the browser. This triggers a connection to the web server. This latter typically sends the following data to the client:
- The HTML code of the page
- A bundle of data, generally through webpack, or equivalent module bundler, which contains all JavaScripts that make the application logic as well as other types of data like CSS and images.
Once the user is connected to the application, he/she can interact with it. Some user actions can trigger the execution of specific JavaScripts (which are part of the downloaded bundle). They can also trigger API calls to external resources, for example to query data and update some parts of the page accordingly.
So, this basic principles emphasizes three aspects of an SPA that you should consider when looking to monitor its performances:
- The initial web page load process
- The JavaScripts execution on the browser
- The subsequent API calls to external resources
Let’s deep dive and see for each one what you should monitor. We then discuss the metrics that can help you as well as the challenges you’ll face when monitoring SPA performance.
The initial web page load process
During the initial web page load process, the browser requests data from the server through a network connection. So first, you should be able to monitor network performances like latency and packet loss. You should monitor these performances for:
- The DNS resolution of the web server host name
- The TCP connection to the server
- The TLS session establishment (most of the web sessions are now secured through TLS)
Next, you should be able to monitor the successfulness of the transaction. Do you get some errors downloading the required resources? Or errors directly from the server that does not allow the transaction or is unable to respond?
And finally, you should be able to know how long it takes for the whole process to happen, not only in terms of data downloading time but also how long it takes for the user’s browser to render the page.
To help you monitor these different steps and elements, the W3C organization provides APIs to compute performance metrics. Navigation Timing and Resource Timing represent the ones you will find the most useful. They provide all metrics required to measure aspects mentioned above.
The JavaScripts execution
As already mentioned above, user interactions may trigger JavaScripts execution.
Obviously, this process takes systems resources from the client device. It can also directly impact the user experience if it takes to long to execute and block the main thread of the browser. In such a case, the user may experience unresponsive application. So monitoring the time it takes for each JavaScript to be executed and run should be monitored as long tasks can directly impact the user experience.
To help you with this, Chrome has developed the First Input Delay (FID) metric. It measures the time from when a user first interacts with a page to the time when the browser is able to react to it, meaning when it is able to begin processing event handlers in response to that interaction. Unfortunately, FID is only used for the first user interaction following a full web page refresh. Considering an SPA, this metric will not be much relevant as it won’t be calculated for all subsequent user interactions.
Fortunately, thanks again to the W3C APIs, it is possible to monitor tasks that take too long to execute and may impact the user. According to W3C, a “Long Task” refers to any event loop task that exceeds 50ms. Using this API can help you detect the usage of code that is too heavy to execute.
Beyond tracking the performance of executing a JavaScript, tracking errors is of course also key. The unsuccessful execution of a JavaScript can indeed disrupt the application logic and greatly affect the user experience.
The API calls
In modern applications, third parties or CDN providers deliver up to ⅔ of the SPA content.
The SPA gets these data through API calls using Ajax.
All network performance measurements relevant to the initial HTML page are also applicable here. The big difference is that the content can this time be delivered by several dynamic locations that you generally do not have under control.
Being able to identify these sources of data, locate them and correlate the data with the corresponding users, devices and locations, is a key element in ensuring adequate SPA performance.
And as it is the case for the initial page load and JavaScripts execution, you should also monitor any error that may occur and identify the root cause.
Monitoring SPA user performance: the challenges
Decentralized data model
Monitoring an SPA is radically different from monitoring a traditional web site.
Using the usual web performance metrics like Page Load Time does not reflect what a real user experiences during his/her SPA journey.
Fortunately, specific APIs let you monitor all events triggered by users interactions.
Nevertheless, as the application logic moves from a centralized server-centric to a decentralized users-centric model, the number of factors that may impact the application performance increases. You do not only rely on the network and server performance anymore. You also must take the browsers and potentially a lot more third-parties (CDNs, CSPs, …) into account.
To help you understand which element(s) of the whole chain mainly drive(s) performance, you have to be able to correlate a lot of data. These should help you answer the following questions where performance problems arise:
- Which transaction(s) are impacted?
- Does the problem impact specific users locations, devices, or browsers?
- Does the problem come from specific transactions to specific external providers? Which provider(s)? In which region(s)? For which API call(s)?
- Are some regions in the world more impacted due to network performance issues? Are some specific operators to blame? Why?
Mapping user interactions to application logic
Next to that, one of the main challenges of monitoring SPA performance resides in the fact that this is difficult to link a specific user action to related JavaScripts execution and API calls.
SPA development technique can help segment the SPA application logic. An SPA router for example defines distinct URLs corresponding to specific application sections, so the user thinks he/she is navigating from one page to another (through different URLs), even if this does not trigger any HTML page refresh. By monitoring route changes, you can identify corresponding events (for example the different API calls) in order to better understand the possible user actions that may cause problems.
Nevertheless, linking specific user actions to events like JavaScripts execution and/or API calls may require implementing additional code in the application itself to make an appropriate and accurate mapping.


