


Page Load Time as metric has been in use for years and has been the main reference to measure browser performance for a long time. Anyone interested in web performance must understand page load time (PLT). Let’s take a look at how it calculated.
A definition of page load time
In short, it represents the time needed to fully load a web page.
First, the diagram hereunder shows the mains phases of the web page load:
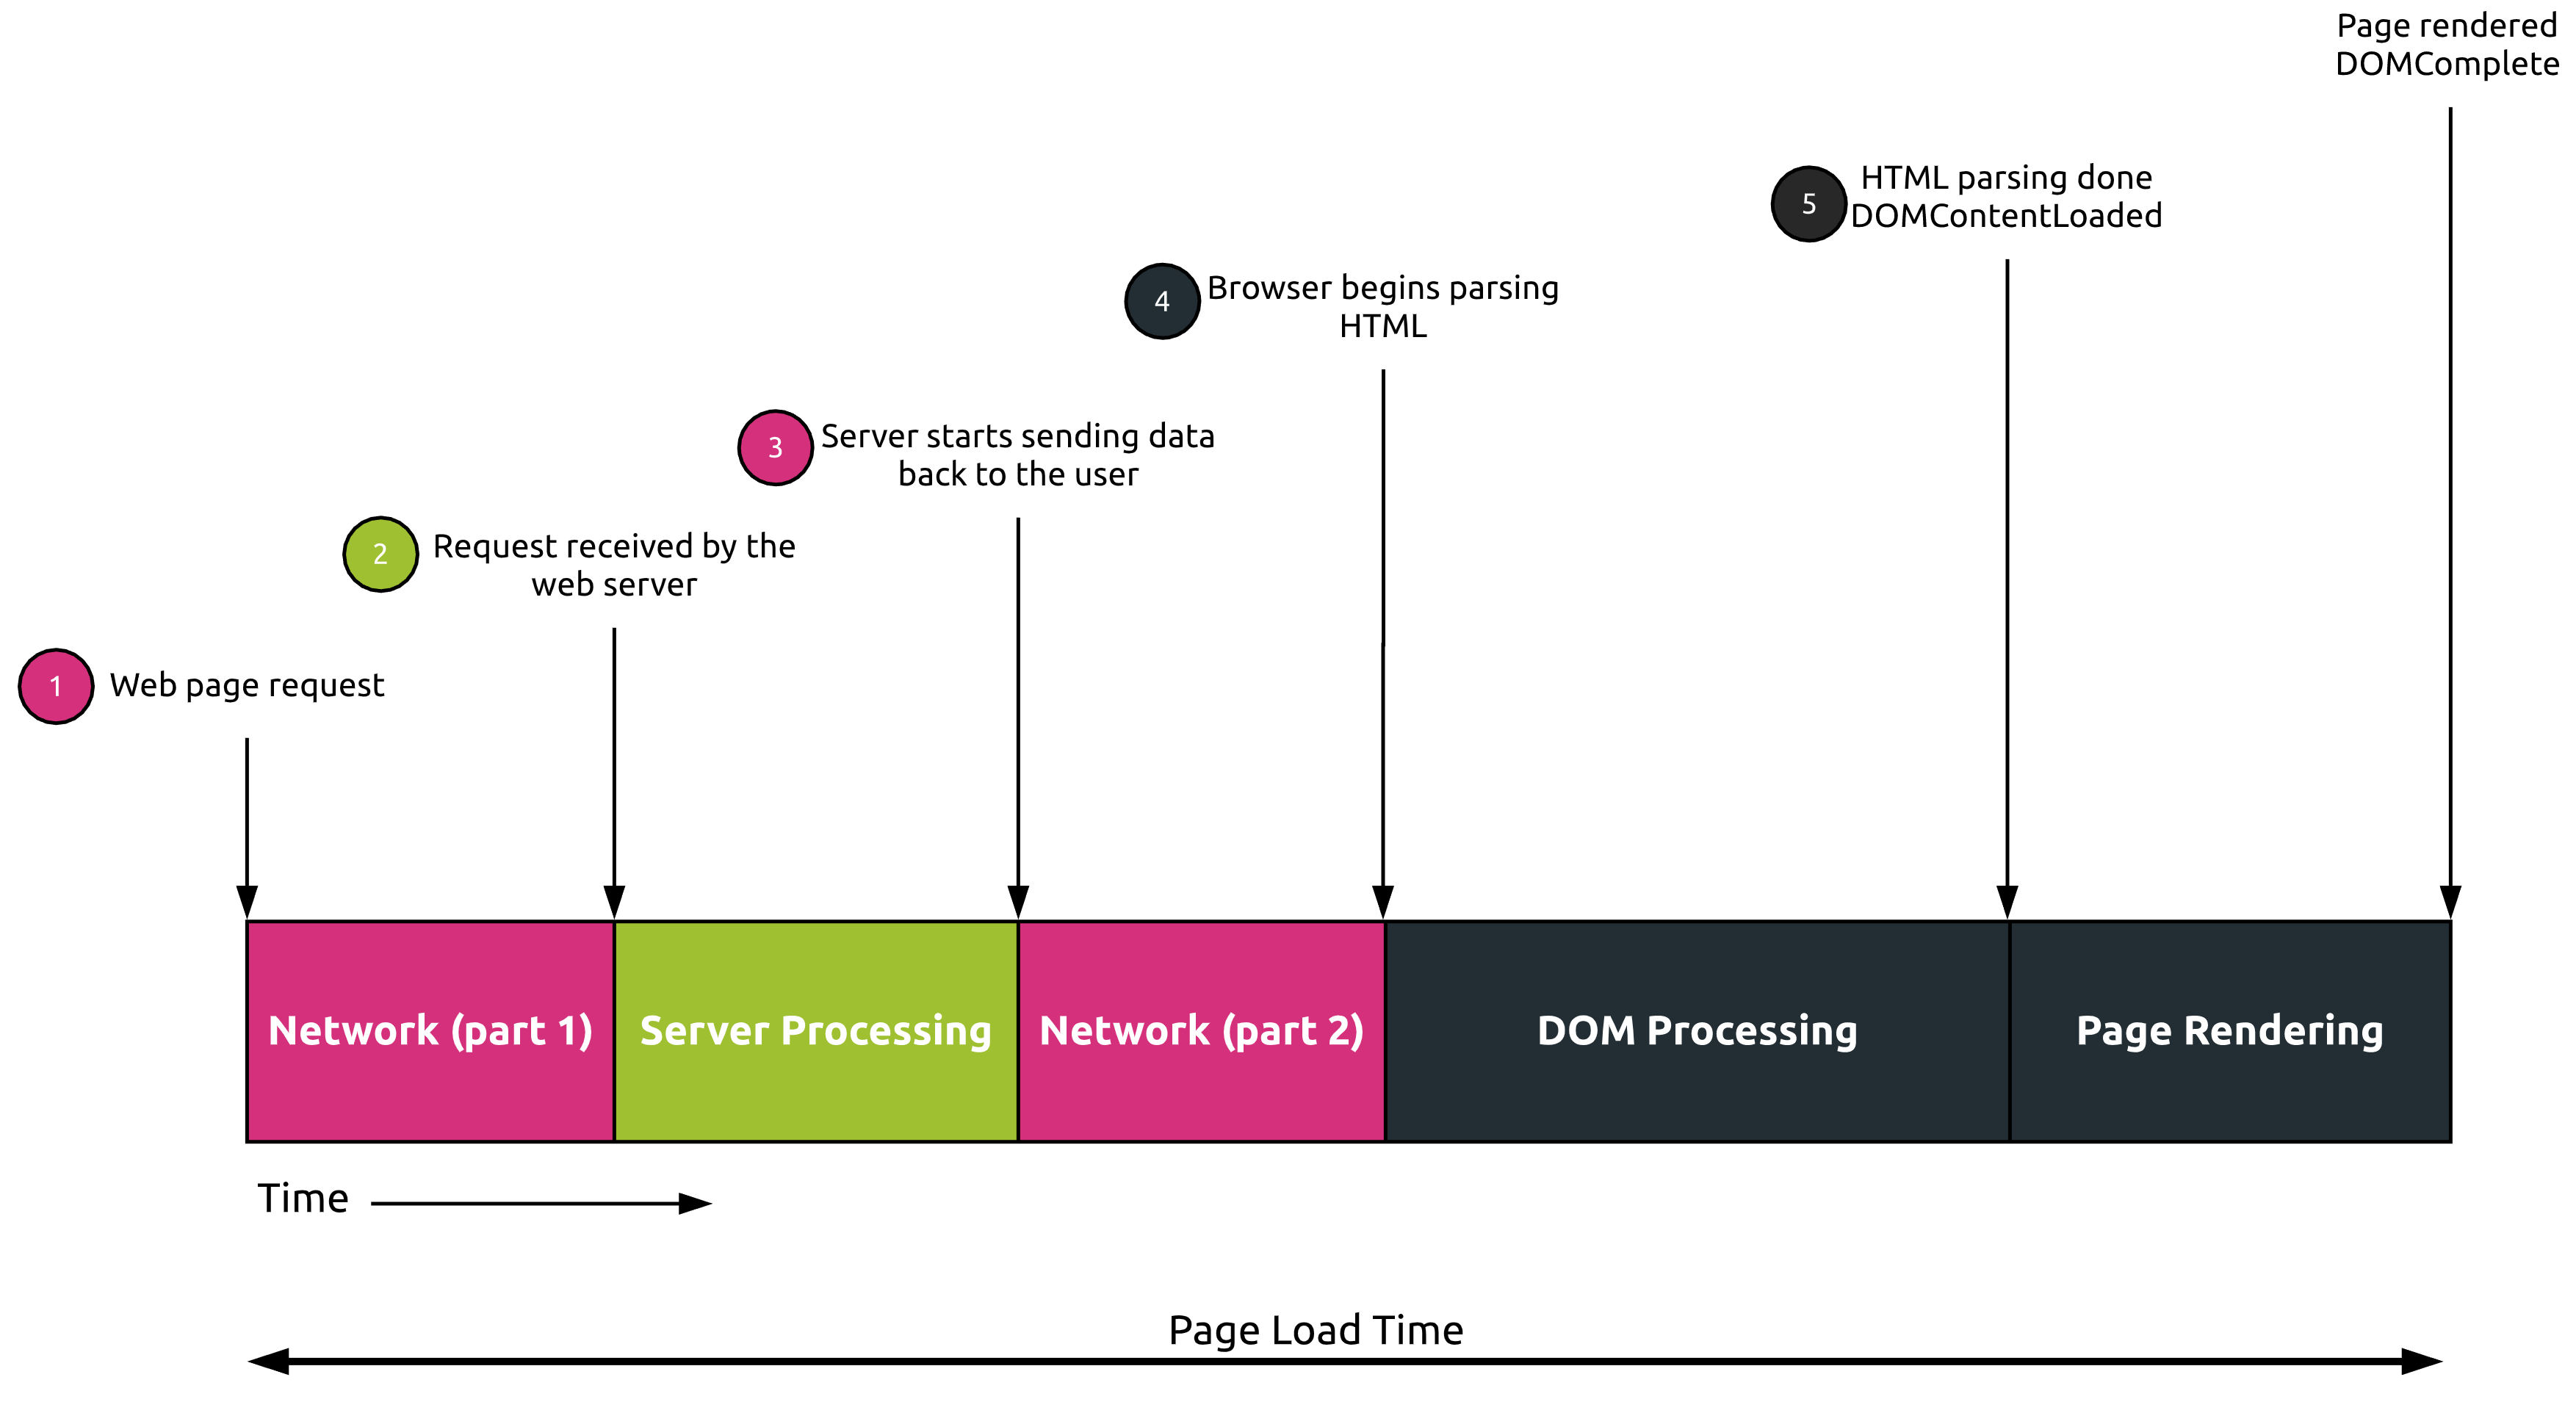
- The user clicks on a web page link or enters a valid URL
The browser performs different steps like resolving the URL if not available in cache (DNS request) and establishing a TCP/TLS session with the server - The server receives the request and processes it
- The server sends requested data to the user’s browser
- The browser starts parsing the HTML code and potentially requests additional resources (CSS, JS, …)
- All elements composing the web page are fully loaded. The browser can start rendering the page on the screen.
As you can see, the Page Load Time measures the time interval from the user’s request time up to the moment the web page is fully loaded and rendered on the screen. At this point, the browser’s spinner stops.
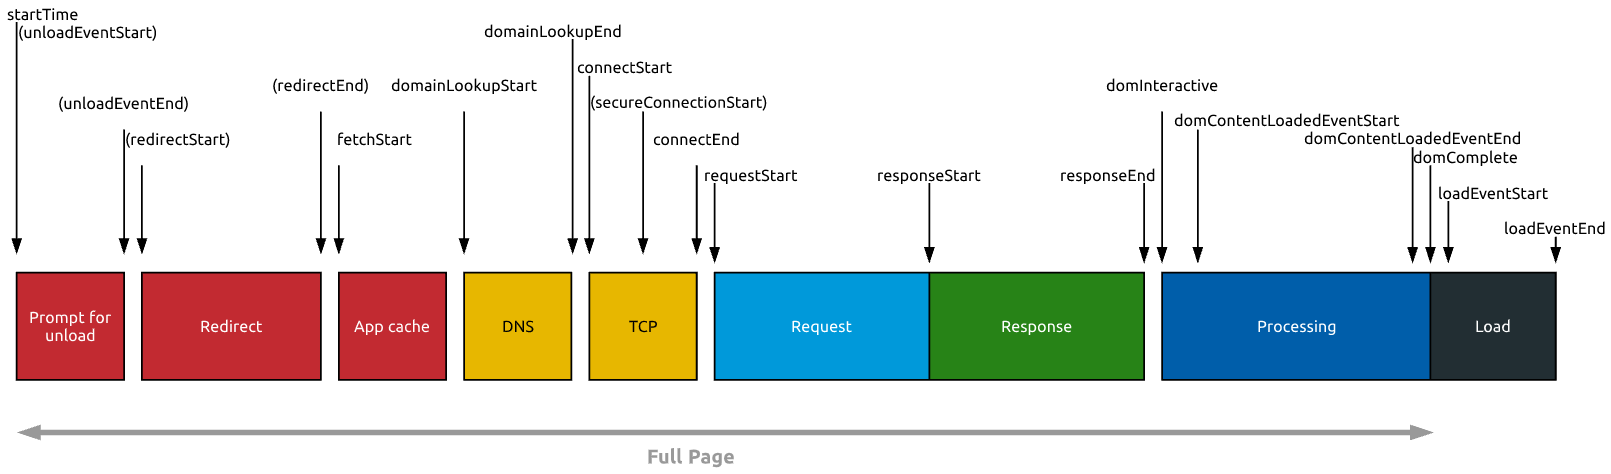
Getting into more details, this second diagram shows the sequence of events represented by the page load time:
How is Page Load Time Calculated?
Kadiska’s metrics computation is based on the Time Navigation API from W3C.
The Page Load Time metric value calculation corresponds to domComplete-startTime.
This calculates the time between the web page request by the browser (startTime) and the point in time all the components are fully loaded (domComplete).
Looking for more user-centric metrics
Even if Page Load Time is still a useful performance metric, it does not precisely represent the real user experience.
Some of the components may indeed still be loaded after all visible elements are painted on the screen.
For that reason, most people consider this metric a “browser-centric” as opposed to the newly introduced “user-centric” metrics. These new metrics provide a more accurate view on performance the way real users perceive it.
To go further in that direction, a better user-centric performance metric related to the page load speed is Largest Contentful Paint (LCP) This metric has been introduced by Google in 2020 and is supported by Kadiska.