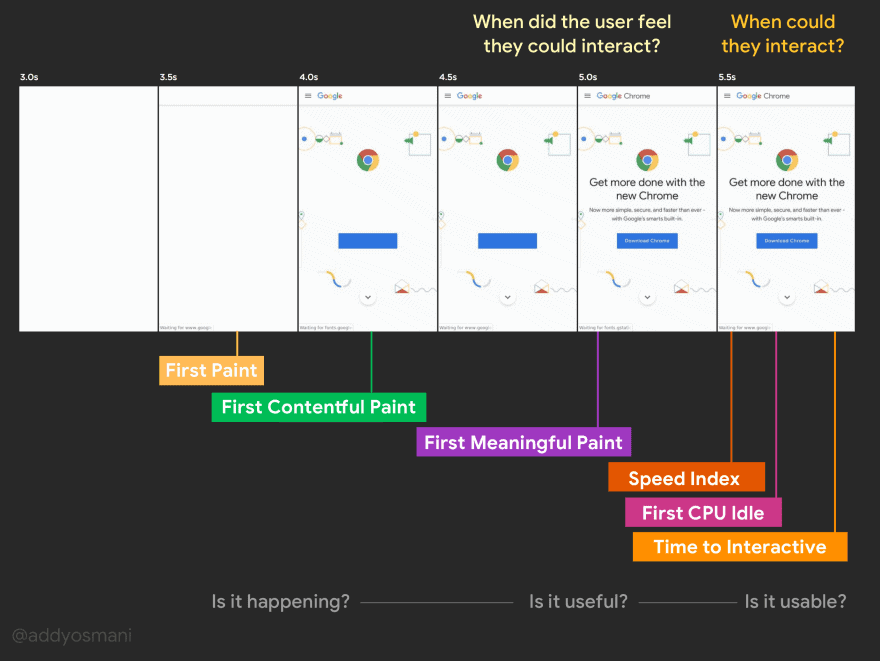
TTI score is related to First Input Delay (FID), but the Time to Interactive performance metric is calculated differently. The user perception of how fast a web site loads, and how quickly they can interact with it is hard to capture with a single performance metric. This is because the loading of a page occurs in several steps which all have an impact on the user experience and interactivity.
Page Load vs. Time to Interactive Metrics
To understand web page load performance you should take a look at several web metrics together. These metrics may include Start Render or Speed Index. However, while these measure the loading speed of a page, they do not provide a time to interactive performance score, or a way to evaluate the interactivity of a web page. The time for a web page to respond to user interaction is a key factor in determining a user’s digital experience, so the TTI score is essential.
Let’s look at what Time to Interactive means and how to improve it.
Why is Interactivity Important?
Some sites optimize the loading speed at the expense of interactivity. This can be frustrating for users. Imagine a web page loads in a short amount of time, but when you interact with it by clicking on a button, nothing happens! This is the problem with slow Time to Interactive sites, and the main reason why you need to improve your TTI to ensure visitors get the best experience.
The Time to Interactive performance score was introduced in 2019. TTI is not fully standardized as it continues to evolve.
What is Time to Interactive?
The TTI score measures the time it takes for a page to become interactive to user input (e.g. react to a click).
Time to Interactive depends on how long it takes three key events to occur:
- the page has loaded the most important content (as defined in the first contentful paint or largest contentful paint (LCP), for example);
- the most visible elements of the page become interactive (clickable or active);
- the page responds to user interactions within a 50 millisecond delay.
These three steps correspond to user perception as:
- Is the page loading?
- Is it useful (should I stay and interact with the site)?
- Is it usable (is it interactive, or unresponsive)?
We all evaluate this interactivity delay each time we interact with a site, which is why improving TTI performance scores are important.
How is Time to Interactive Calculated?
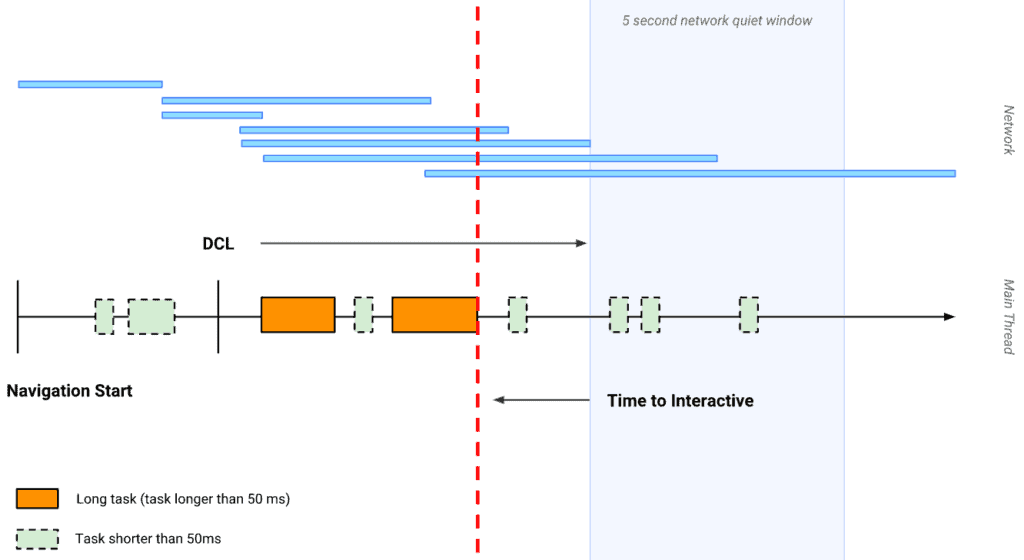
The computation of the TTI performance score combines data from the page load “waterfall” and network activity. There are 3 steps needed to create the Time to Interactive score:
- Define the starting point: it may be the FCP (First Contentful Paint) or DOM Content Loaded End.
- From this starting reference point, identify a period of 5 seconds where the network is stable and there is no long task (>50ms) executing (a network quiet window).
- From here, identify when the last long task finished executing. This is the endpoint of the Time to Interactive performance score.
So, the TTI interactive page metric is the elapsed time between the starting point (1) and the end (2) defined by the completion of the last long task before a five second idle period. Because of this definition, Time to Interactive cannot be measured before the loading of the whole page has been analyzed.
Here is a simple drawing to illustrate the calculation of Time to Interactive:
Tips for Calculating TTI Performance Score
- First Meaningful Paint (FMP) is not a standard reference for TTI measurement; DOM Content Loaded End (DCL) is preferred.
- You cannot measure TTI before the network is stable.
- The Time to Interactive delay always corresponds to the end of a long task.
- You have to wait for a minimum of 5 seconds before a page’s Time to Interactive can be calculated.
- The TTI score does not consider the page interactive until the DOM building is complete. This means the TTI can only be measured after the DOMContentLoadedEnd event even if the network was already quiet for 5 seconds.
How can I Measure Time to Interactive?
Time to Interactive is only available on browser based tools (like the Lighthouse Chrome extension) and synthetic testing tools (like Google’s page speed insights). Real user monitoring (RUM) tools which collect performance data through a browser’s NavigationTiming API cannot measure the Time to Interactive.
This is one of the reasons why First Input Delay (FID) was introduced. FID is easier to calculate than TTI and is reported by both RUM and synthetic monitoring tools.
How to Improve Time to Interactive
The biggest factor driving delays in Time To Interactive is Javascript execution blocking page rendering. The more scripts loaded, the longer TTI is delayed. The performance of scripts and their impact on Time to Interactive depends greatly on the user’s device. The slower the processor, the longer it will take the browser to analyze and compile the scripts. This is why users of mobile devices often experience Time to Interactive web performance issues.
As a web developer you have two main options to improve TTI:
- Delete any unnecessary scripts from your page
- Defer them to run after the elements driving Time to Interactive have loaded (e.g. asynchronous execution)
Read this article to learn more about improving Time to Interactive for your web visitors.
Kadiska’s extensive digital experience and network performance metrics provide deep insight into the main factors that drive poor Time to Interactive performance scores. From high-level user experience scores to detailed waterfall page load transactions, you can quickly isolate performance bottlenecks to deliver a responsive, interactive experience to engage visitors, customers and employees accessing your application.


