Testing Google Meet to resolve video call performance issues with meet.Google.com can be fast and efficient with real-time network performance monitoring (NPM) and routing analysis, when integrated with testing Google Meet digital experience (DEM). This approach allows you to test Google Meet from the caller context, browser and location, and understand if Google meeting issues originate from Google Meet media servers, network connectivity or the users’ device. Conducting a regular Google Meet test across key office and work from home locations helps IT optimize connectivity and browser performance to enhance the digital user experience of Meet calls for employees, customers and other guests.
Video Transcript
How to Troubleshoot Google Meet Performance Issues
When monitoring performance of collaborative platforms like Google Meet, there are two main aspects to take into account. First, the users have to access the platform itself. They connect to a SaaS application that has to be responsive, and you should be able to understand all transactions.
Next, the users will join an interactive audio-video streaming session. If you want to ensure this session to be of high quality, you must be able to monitor network performance to the media servers.
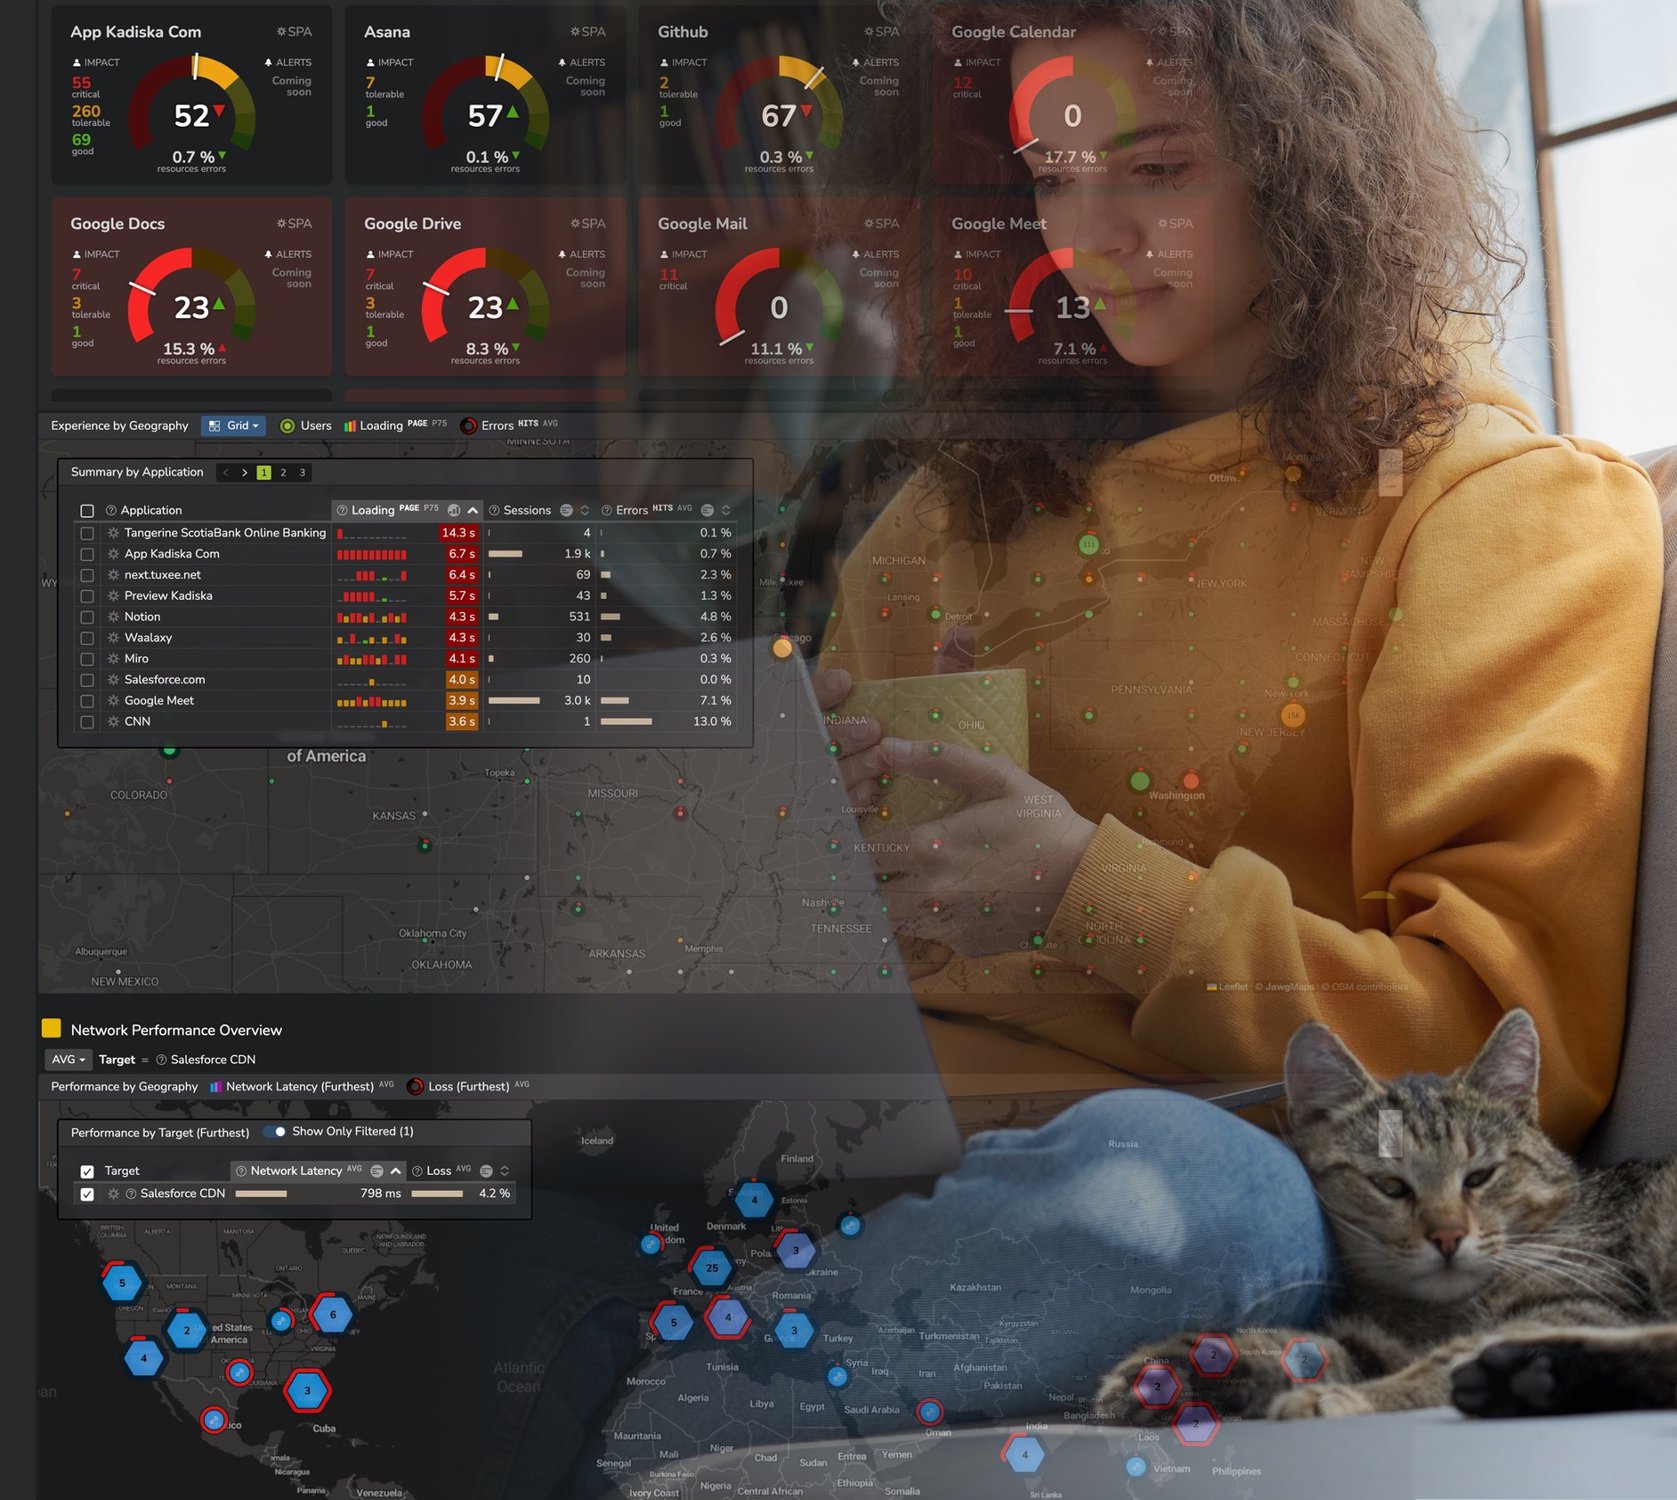
Let’s focus on the initial transactions first, and in this small example, you can see that 12 people have used the Google Meet platform for a total of nine hours and 42 minutes. These connected mainly from France, from Belgium and from Canada.
Connecting to the Google Meet platform doesn’t mean your browser will only interact with a single server. In fact, there are a lot of different services involved. For example, here you see a server that is delivering static content, and if you want to identify the content navigate to the resource dashboard, and you can identify all the different resources that are being delivered by this content server. For example, an image that corresponds to the Meet logo.
But coming back on the different servers that deliver the Google Meet application, it’s important for you to monitor the respective performance. Here you can see that the average response time for all servers was sometimes degraded. By simply focusing on the specific degradation I can quickly identify the Google Meet sessions that were impacted.
So for example, here, this one was impacted by a slower server response time. Let’s see who was impacted. I can simply focus on this specific Google Meet session, and I can navigate to the user group’s dashboard. In this case, you see two users, one connected on the local ISP Orange in France, the second connected on the Altima Telecom ISP in Canada.
Both users are working from home, and you can identify them. So here my colleagues, Scott and Boris, were in a call for 15 minutes. And by the way, Boris was the most impacted by this server response time on the Orange ISP.
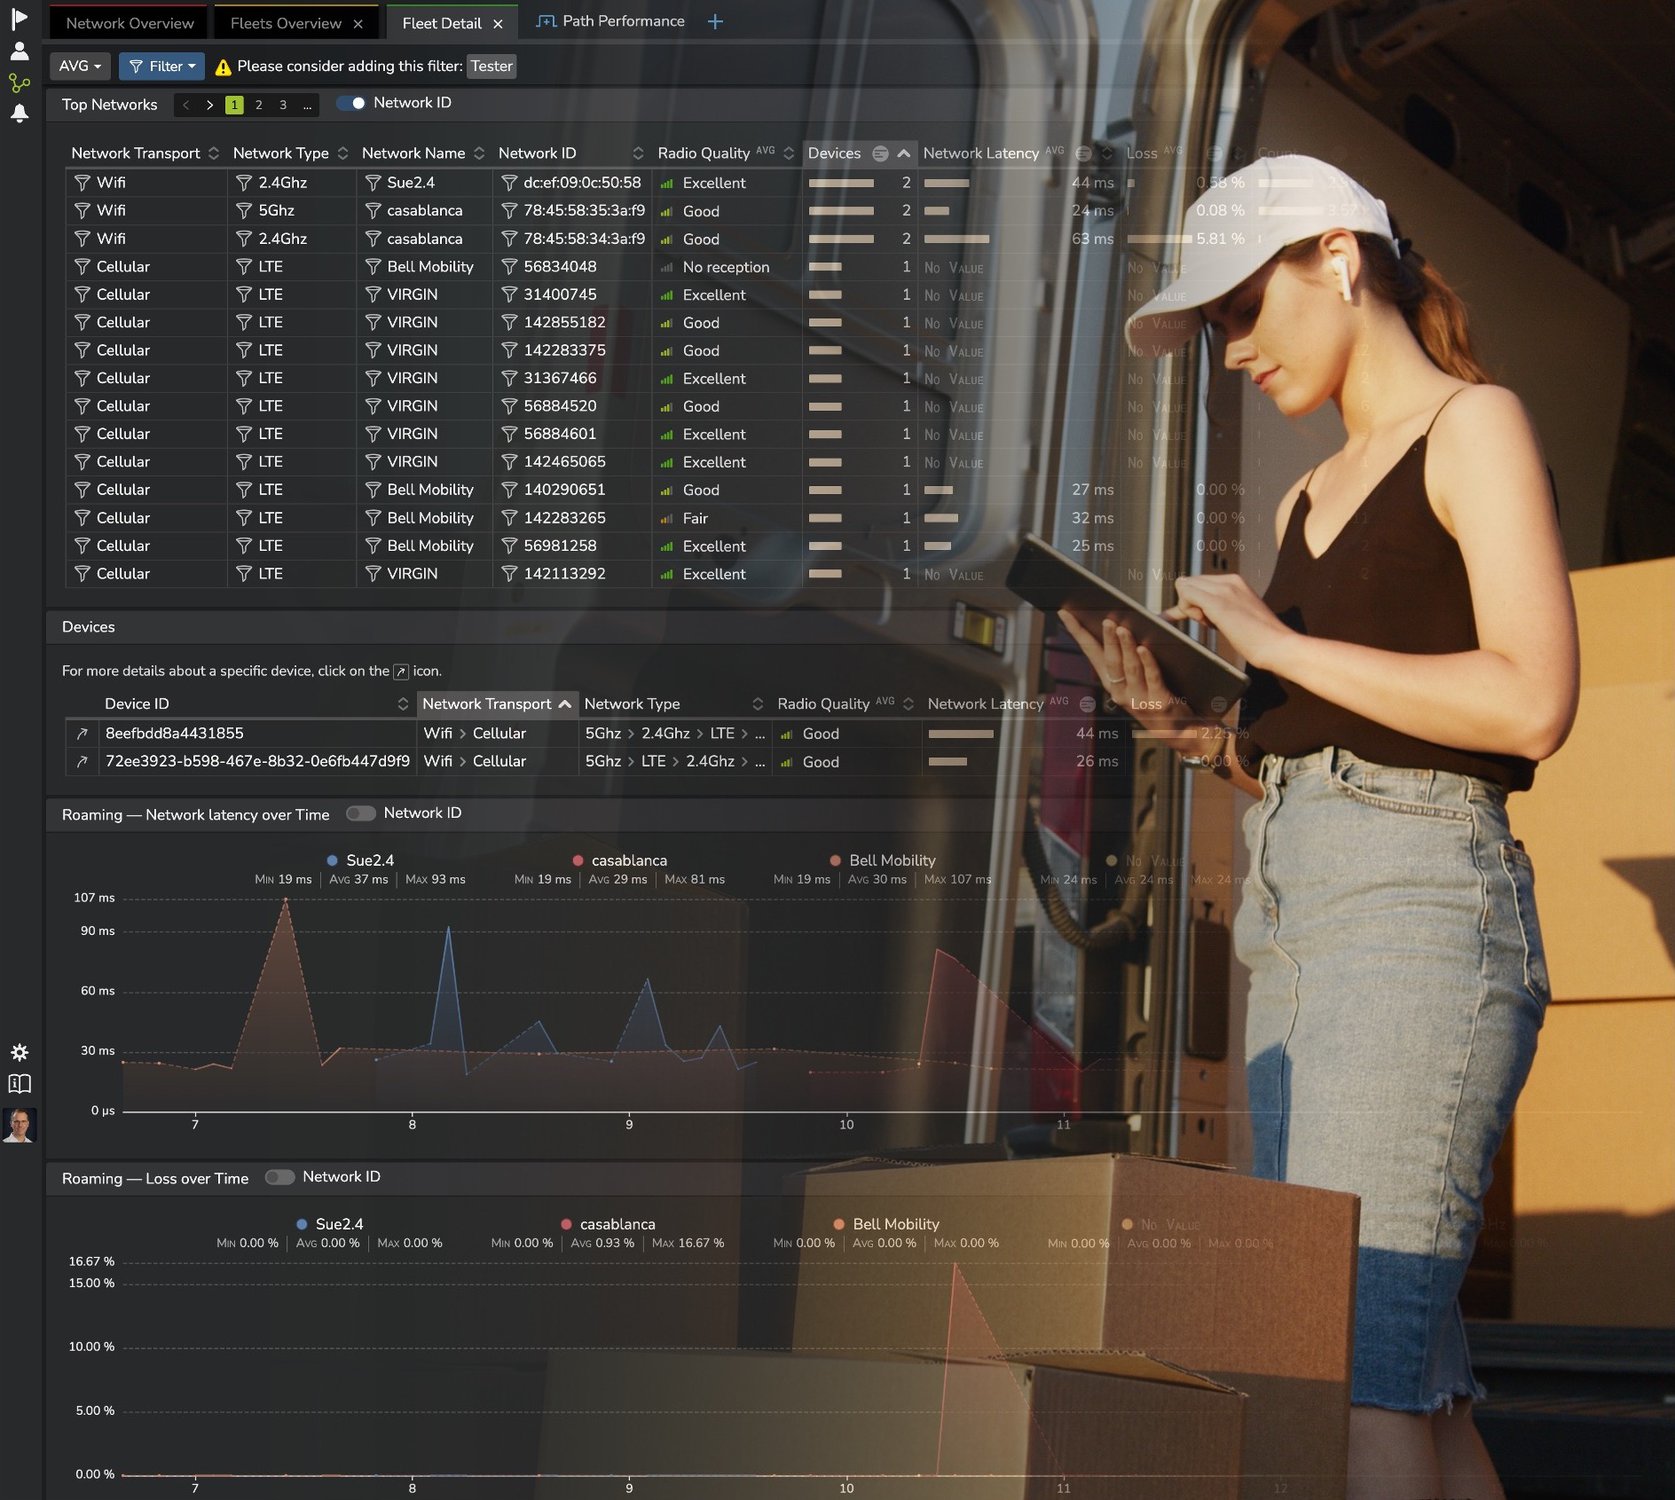
The second aspect to take into account is the network latency from the users to the media servers. These servers manage the real time audio and video streaming. The good news with Google Meet is that each user normally connects to a local media server according to his or her geolocation.
Google recommends to keep the network latency below 100 milliseconds in order to guarantee proper end user experience. It also means that the traffic should reach the Google network backbone as quickly as possible. Ideally, your local ISP should directly peer with Google. Let’s now have a quick look at the real case example.
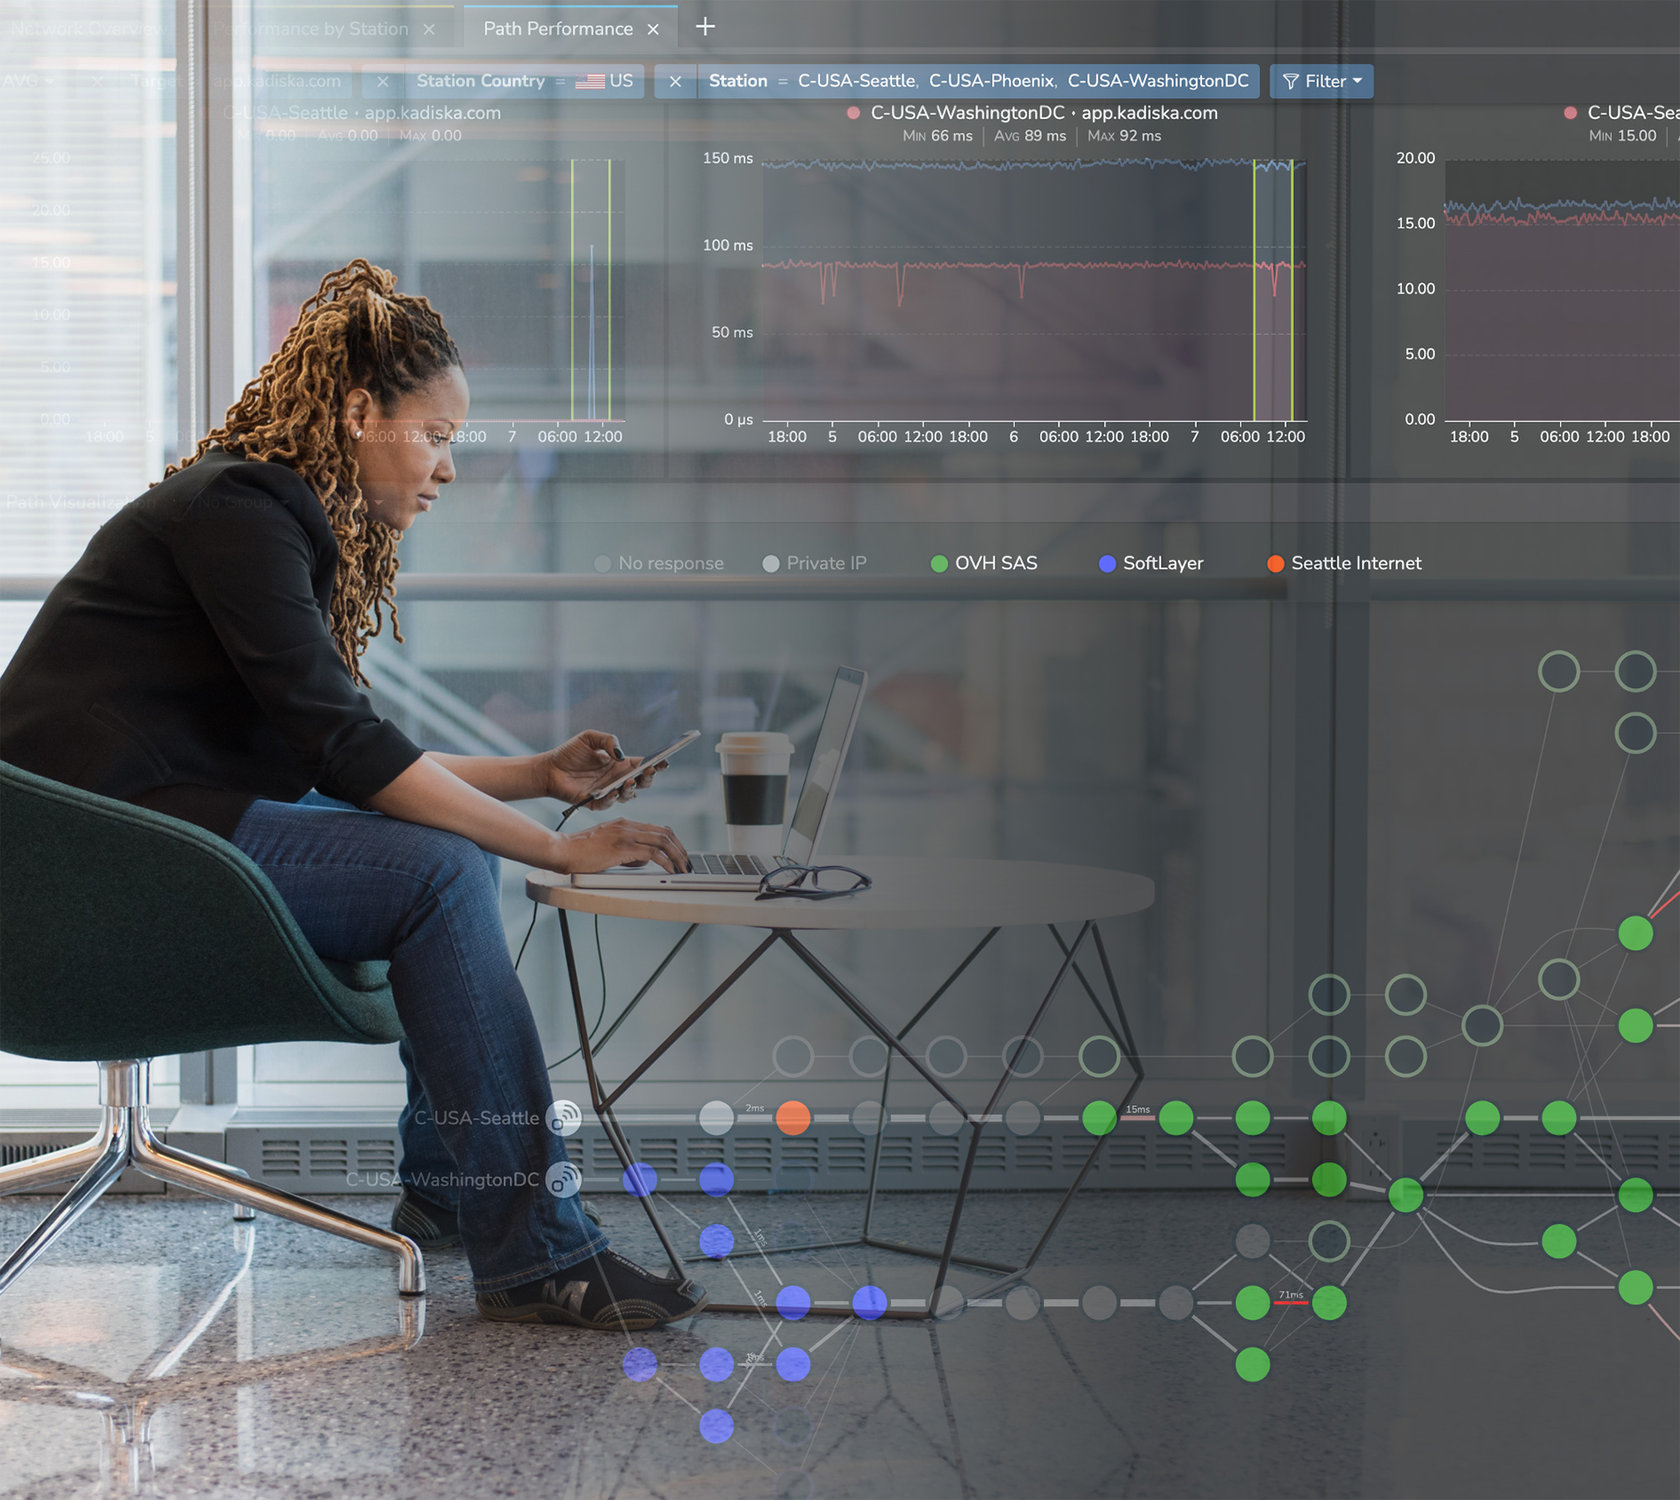
The graph here shows the streaming traffic network pass between a user located in Paris and a local Google Media server. As you can see, the user first connects to the Orange local ISP, and you see that Orange doesn’t peer directly with a Google backbone network. Instead Orange peers with Telia that finally peers with the Google network.
Where is most of the delay being introduced? By highlighting the delays, you get the answer immediately. You see that most of the delay is introduced within the Google network itself, and is not caused by the two ISPs.
Here the average connectivity performance is five to two milliseconds, far below the recommended value.
Kadiska was designed to monitor the digital experience of SaaS applications and how network routing performance impacts it.